Subscribe now to get notified about IU Jharkhand journal updates!
This study explores customer responsiveness in the Indian hospitality sector, focusing on the key drivers, expectations, and business impact. Through a structured quantitative approach, responses were collected from a diverse demographic profile of hotel guests across India. Using principal component analysis, four major dimensions were identified: responsiveness, customer engagement, customer connectivity, and promotional appeal. The findings reveal that service attributes are not perceived uniformly—some factors such as staff friendliness, prompt response, and digital communication exert significantly greater influence on customer satisfaction and hotel selection. Hypothesis testing confirmed statistically significant associations between customer responsiveness and demographic variables including age, gender, education, profession, and income. Moderate effect sizes indicate that while these factors do influence perceptions, the variation is not highly intense, suggesting the need for targeted yet inclusive service strategies. Additional analyses, including Hotelling’s T² and ANOVA, confirmed perceptual differences and nonadditive interactions among service attributes, reflecting the complex and interrelated nature of customer experiences. The study underscores the need for Indian hospitality businesses to blend technological solutions with personalized human service to meet rising
In today's hypercompetitive hospitality landscape, customer responsiveness has emerged as a critical determinant of business success and sustainability (Kumar and Pansari, 2016). The Indian hospitality sector, valued at approximately USD 247 billion in 2023, represents one of the fastest-growing service industries globally, with projected annual growth rates exceeding 7.2% through 2027 (Sharma and Joshi, 2023). This remarkable expansion is accompanied by heightened customer expectations regarding service quality, particularly in terms of the speed and effectiveness with which businesses respond to customer needs, queries, and concerns (Malhotra, 2022). As digital platforms and social media transform consumer behaviour, the concept of customer responsiveness has evolved from a mere operational metric to a strategic imperative that significantly influences customer satisfaction, loyalty, and ultimately, business performance (Bhattacharya and Roy, 2024).
Customer responsiveness encompasses the capacity of hospitality establishments to acknowledge, address, and resolve customer requirements promptly and effectively across multiple touchpoints in the service journey (Anderson and Srinivasan, 2021). In the Indian context, this concept carries additional complexity due to the country's diverse cultural landscape, varying consumer expectations across different demographic segments, and the coexistence of traditional and modern service paradigms (Gupta et al., 2022). Research by Deb and Lomo-David (2021) indicates that responsiveness ranks among the top three factors influencing customer satisfaction in Indian hotels, restaurants, and travel services, highlighting its significance in shaping consumer perceptions and behaviours.
The digital transformation of the hospitality industry has fundamentally altered the dynamics of customer responsiveness. Online review platforms such as Zomato, TripAdvisor, and Google Reviews have empowered consumers to publicly evaluate service experiences, with response time and quality emerging as frequent themes in customer feedback (Kaushik et al., 2023). A comprehensive analysis of over 25,000 reviews of Indian hospitality establishments revealed that 67% of negative reviews mentioned delayed or inadequate responses to customer queries or complaints, while 82% of five-star reviews specifically praised prompt and effective staff responses (Verma and Singh, 2024). These findings underscore the critical role of responsiveness in shaping online reputation, which increasingly functions as a key driver of consumer decision-making in the hospitality sector.
The COVID-19 pandemic further amplified the importance of customer responsiveness as hospitality businesses navigated unprecedented challenges and rapidly evolving consumer expectations (Chawla and Sharma, 2022). Establishments that demonstrated agility in responding to safety concerns, implemented transparent communication strategies, and adapted service delivery models in accordance with customer feedback demonstrated significantly higher recovery rates than their less responsive counterparts (Rao and Mehta, 2023). This crisis-induced evolution has permanently elevated customer expectations regarding responsiveness, creating new standards that hospitality businesses must meet to remain competitive in the post-pandemic landscape.
Despite its evident importance, customer responsiveness in the Indian hospitality context remains underexplored in academic literature, with limited empirical research examining its antecedents, dimensions, and outcomes. Existing studies have predominantly focused on Western markets or broader Asian contexts, often failing to account for the unique characteristics of Indian consumer behaviour and business environments (Malhotra and Shah, 2022). Furthermore, much of the available research examines responsiveness as a component of broader service quality constructs rather than as a distinct phenomenon warranting dedicated investigation (Kumar et al., 2023). This theoretical gap impedes the development of context-specific strategies for enhancing responsiveness in Indian hospitality establishments.
From a practical perspective, hospitality managers face significant challenges in developing and implementing effective responsiveness strategies. These challenges include resource constraints, technical limitations, training inadequacies, and difficulties in balancing standardization with personalization (Bhat and Sharma, 2024). Additionally, the rapid proliferation of customer touchpoints across physical and digital channels has complicated efforts to maintain consistent responsiveness across all interaction platforms (Jain and Kaur, 2022). The absence of comprehensive frameworks for measuring, monitoring, and improving responsiveness further compounds these operational challenges, highlighting the need for rigorous research that bridges theory and practice.
This paper aims to address these theoretical and practical gaps by developing a comprehensive understanding of customer responsiveness in the Indian hospitality sector. Specifically, the research seeks to explore the key drivers and customer expectations surrounding responsiveness in the Indian hospitality sector, and to assess its impact on loyalty and business outcomes.
The significance of this research extends beyond academic contributions. As the Indian hospitality sector recovers from pandemic-related disruptions and positions itself for sustainable growth, optimizing customer responsiveness represents a strategic priority for businesses seeking competitive differentiation (Khanna and Mitra, 2023). Moreover, with international hotel chains expanding their Indian footprint and domestic players enhancing their service standards to compete globally, establishing evidence-based best practices for responsiveness becomes increasingly vital (Singh and Kumar, 2024). This research therefore addresses a pressing industry need while advancing theoretical understanding of a critical but understudied aspect of service excellence.
By adopting a mixed-methods approach that combines quantitative analysis of consumer data with insights, this study aims to develop nuanced, context-specific knowledge that can guide both academic discourse and management practice. The findings will contribute to the growing body of literature on service management in emerging economies while providing actionable recommendations for hospitality practitioners seeking to enhance their responsiveness capabilities in an increasingly customer-centric marketplace.
LITERATURE REVIEW
Being satisfaction requirements evolve, user responsiveness—defined as the ability of the business to promptly and efficiently adjust to client requirements, tastes and shifting economic demands—has become more and more important (Kohli and Jaworski, 1990). This idea becomes especially complicated in the Indian perspective because of the country's varied historical surroundings, different economic sectors, and the combination of centuries-old welcoming principles with contemporary supply-chain methods.
Numerous important theories form the scientific basis of client response in the field of hospitality. In their groundbreaking SERVQUAL model, Parasuraman, Zeithaml, and Berry (1985) identified sensitivity as one of a total of five essential aspects of excellence in service, along with material items, confidence understanding, and dependability. Their research showed that responsiveness—which is defined as being eager to assist clients and offer timely service—has a big impact on client retention and happiness.
The concept of customer responsiveness has been broadened by recent international research to encompass omnichannel service delivery and digital responsiveness. According to Kim and Law (2015), customer responsiveness in the digital age encompasses more than just in-person contacts; it also includes social media involvement, online question resolution, and real-time communication capabilities. Rapid digitalization has changed client expectations and service delivery methods in the Indian hotel industry, making this digital dimension especially pertinent.
The hotel and restaurant sector in the country has distinct features that set it apart from businesses in Western countries.In an in-depth investigation spanning 15 prominent Indian townships, Sharma and Mehta (2018) found that sociocultural influences, staff involvement levels of difficulty, and bureaucratic structures of leadership all have a substantial impact on customer responsiveness in Indian properties. According to their research, businesses with enhanced staff autonomy and shallower organizational arrangements outperformed conventional authoritarian institutions in terms of attentiveness criteria.
Approaches for consumer response are made more challenging by the wide variety of the Indian industry. Gupta and Vajic (2000) emphasized that Indian tourism enterprises need to serve a wide range of clientele, spanning luxury-seeking foreign visitors to frugal national tourists. The universally applicable provisioning strategies frequently used in more unified markets are challenged by this differentiation, which calls for distinct responsiveness tactics. Malik (2015) suggested that the most important requirement for acquiring and maintaining users is excellent management and a workable framework. It'sreally hard to stay in company having customers, and it's hard to stay profitable absent satisfied customers. Excellent management benefits not just the clients but the entire firm. Customer have access to both internal and external authorities, which begin with a single contact or sector and proceed to the next. Accordingly, effective management is essential to every enterprise.
Kumar (2020) concluded by stating that gap between international and Indian standards in the hospitality sector is decreasing, requiring Indian hospitality to improve rules and regulations for staff satisfaction. The researcher also summarised that with international organizations investing in India, the sector focuses on customer satisfaction, market share improvement, and quality services. The costing approach based on operation impacts efficiency, with human behaviour being a key performance indicator. Job satisfaction is crucial for optimum customer satisfaction, and a comprehensive human resources policy and professional manpower management system are needed to minimize attrition rates and foster loyal staff.
The integration of technology in enhancing customer responsiveness has gained significant attention in both Indian and international literature. International research by Buhalis and Leung (2018) established the framework for smart tourism and hospitality, emphasizing how artificial intelligence, Internet of Things (IoT), and mobile technologies can enhance responsiveness through predictive analytics and personalized service delivery.
The emergence of online travel agencies (OTAs) and review platforms has transformed customer responsiveness expectations in India. Mishra and Sharma (2019) analyzed over 50,000 customer reviews across major Indian hotel booking platforms, identifying that response time to customer complaints and queries on digital platforms significantly influenced overall customer satisfaction and booking decisions. Their study revealed that hotels responding to online reviews within 24 hours achieved 15% higher occupancy rates compared to those with slower response times.
Employee empowerment emerged as a critical factor in multiple studies. Verma and Singh (2018) demonstrated that Indian hospitality employees with higher levels of decision-making authority were more capable of providing responsive service, particularly in handling customer complaints and special requests. However, their research also revealed that traditional hierarchical structures in many Indian organizations limit employee empowerment, creating barriers to effective customer responsiveness.
Training and development programs specifically focused on customer responsiveness have shown significant impact in the Indian context. A comprehensive training intervention study by Mehta and Khanna (2019) across 25 Indian hotel chains demonstrated that structured responsiveness training programs resulted in 42% improvement in customer satisfaction scores and 31% reduction in complaint resolution time. Their program emphasized cultural sensitivity, emotional intelligence, and problem-solving skills.
Rahman (2025) in one of hid researches commented that one of the most important considerations for every hotel business is guest happiness. Good housekeeping practices, such as hotel operations, administrative procedures, cleanliness services, simple reservation methods, and plenty more, improve how guests feel. Another factor contributing to increased income is a happy customer.
Ali et al. (2021) conducted a thorough investigation on the connection amongst client fulfillment and aspects of service excellence in tourism environments. A total of 111 people participated in the study, which indicated that while trustworthiness had an adverse connection overall client fulfilment , the other four aspects of service quality—empathy, adaptive design, confidence and tangibleness—had a beneficial association. The investigation offers vital information about how client engagement in restaurant settings is affected directly by responsiveness as a service-oriented component.
In the backdrop of the Indian tourism sector, Jojomon and Manu's latest paper from 2021 emphasizes especially on service recuperation assessments in vacation rental marketplaces.The study offers important information into the development of complaint rehabilitation tactics in high-touch settings by analyzing how online resources have influenced consumer perceptions and disaster process recovery in the Indian industry of hospitality.
Gandhi and Dube's (2020) study looks at how automation might improve hospitality offerings instead of take the place of interpersonal interaction. The report discusses how the tourism industry may continue to provide high-touch interactions despite utilizing digital to increase adaptability; this is especially important in the wake of the epidemic.
Literature Gap
Sr. No. |
Area Covered in Literature |
Key Findings |
Identified Gaps |
1 |
Customer Responsiveness (General Concept) |
Defined as the business's ability to adapt to customer needs efficiently (Kohli & Jaworski, 1990). |
Lack of India-specific contemporary frameworks that incorporate both cultural values and digital responsiveness. |
2 |
SERVQUAL Framework |
Responsiveness as a core component influencing satisfaction and retention (Parasuraman et al., 1985). |
Needs contextual adaptation to the Indian hospitality environment with varied customer expectations. |
3 |
Digital Responsiveness |
Involves online query handling and real-time interactions (Kim & Law, 2015). |
Limited research on real-time digital responsiveness implementation in Indian hotels, especially mid-tier and budget segments. |
4 |
Cultural and Organizational Context (India) |
Indian responsiveness affected by socio-cultural values and hierarchical systems (Sharma & Mehta, 2018). |
Scarcity of studies on how organizational culture reforms improve responsiveness in non-metro Indian hotels. |
5 |
Client Segmentation in India |
Varying expectations between foreign and local tourists (Gupta & Vajic, 2000). |
Few targeted strategies available to cater to diverse clientele through customized responsiveness approaches. |
6 |
Role of Management |
Effective management critical to customer satisfaction (Malik, 2015). |
Lack of empirical data linking management strategies directly to responsiveness outcomes in hospitality. |
7 |
Internationalization and HR Practices |
Workforce motivation and HR systems impact service quality (Kumar, 2020). |
Insufficient exploration of HR responsiveness models integrating international practices in Indian settings. |
8 |
Technology and Smart Tourism |
AI, IoT, and mobile tech improve responsiveness (Buhalis& Leung, 2018). |
Limited empirical studies on smart tech integration in mid-sized Indian hospitality ventures. |
9 |
Online Reviews and OTAs |
Faster responses improve booking decisions (Mishra & Sharma, 2019). |
No unified metrics or KPIs adopted by Indian hotels to benchmark digital responsiveness effectiveness. |
10 |
Employee Empowerment |
Autonomy improves service delivery (Verma & Singh, 2018). |
Lack of scalable empowerment models to transition traditional setups into responsive service units. |
11 |
Training and Development |
Structured training boosts satisfaction and reduces complaint times (Mehta & Khanna, 2019). |
Sparse longitudinal studies to measure sustained impact of such training on service culture. |
12 |
Operational Factors (Housekeeping, Booking) |
Cleanliness and process efficiency enhance guest happiness (Rahman, 2025). |
Needs further validation through large-scale data across different hotel formats (budget, luxury, etc.). |
13 |
Service Quality Dimensions |
Empathy, assurance, and tangibility directly influence satisfaction (Ali et al., 2021). |
Need to refine measurement tools specifically for the Indian context and tier-2/3 cities. |
14 |
Service Recovery Mechanisms |
Online feedback and complaint redressal affect perception (Jojomon& Manu, 2021). |
Limited frameworks available for proactive service recovery in Indian digital hospitality channels. |
15 |
Balancing Automation and Human Touch |
Automation should complement—not replace—human service (Gandhi & Dube, 2020). |
No clear guidelines for integrating automation without losing personalization in Indian customer service. |
Based on above table 1five major consolidated research gaps identified that can form the coe focus areas of this research study:
1. Lack of India-Specific Frameworks for Customer Responsiveness
Gap Clubbed From:
o General concept of responsiveness (Kohli & Jaworski, 1990)
o SERVQUAL model (Parasuraman et al., 1985)
o Diverse client segmentation (Gupta & Vajic, 2000)
Research Gap:Existing theories are predominantly Western-centric. There is a need to develop a contextualized, India-specific customer responsiveness framework that incorporates local values, service expectations, and consumer behavior patterns unique to Indian hospitality.
2. Inadequate Integration of Digital Responsiveness and Smart Technologies
Gap Clubbed From:o Digital responsiveness (Kim & Law, 2015)
o Smart tourism technologies (Buhalis& Leung, 2018)
o OTA/review responsiveness (Mishra & Sharma, 2019)
Research Gap:There'sa limited understanding of how Indian hotels—especially mid-sized and budget ones—adopt and benefit from digital and AI-based responsiveness tools. Research should explore barriers, effectiveness, and ROI from tech integration.
3. Organizational and HR Barriers to Responsiveness
Gap Clubbed From: o Sociocultural and hierarchical influences (Sharma & Mehta, 2018)Research Gap:Rigid organizational structures and lack of empowerment limit service responsiveness. Research can focus on designing HR policies and organizational reforms to enhance frontline service agility and autonomy.
4. Limited Measurement and Training Models for Sustained Responsiveness
Gap Clubbed From:o Training outcomes (Mehta & Khanna, 2019)
o Operational excellence & guest happiness (Rahman, 2025)
o Service quality factors (Ali et al., 2021)
Research Gap:There is a lack of validated training models and performance measurement tools that ensure long-term improvement in responsiveness. Studies should evaluate impact over time and across hotel categories.
5. Balancing Personalization and Automation in Customer Service
Gap Clubbed From:o Human vs. digital touch (Gandhi & Dube, 2020)
o Service recovery via online feedback (Jojomon& Manu, 2021)
Research Gap:Hotels struggle to balance digital automation with human interaction.There's a gap in frameworks that guide appropriate digital-human service blending for Indian consumers, particularly post-COVID.
Research MethodPARAMETERS |
BRIEF NOTE |
Type of Research |
Descriptive Cross-Sectional Design |
Data Collection Method |
Primary & Secondary (Mixed Method) |
Data Collection Time |
December 2024 to February 2025 |
Research Instrument |
Survey Questionnaire |
Survey Administration |
Google Form |
Sampling Type |
Convenience & Snowball Sampling |
Sampling Size |
572 |
Statistical Analysis |
Reliability test, Descriptive statistics, Factor Analysis, KMO Bartlet |
Hypothesis Testing |
ANOVA, Tukey’s Test, Hotelling’s T-Squared Test, Welch test, Brown & Forsythe test |
Software Tools |
IBM SPSS Version 23.0 |
The present study adopted a descriptive cross-sectional design to explore customer responsiveness within the Indian hospitality sector. A mixed-method approach was used for data collection, incorporating both primary and secondary sources. The primary data was gathered using a structured survey questionnaire administered digitally via Google Forms. The data collection period spanned from December 2024 to February 2025. Convenience and snowball sampling methods were employed to recruit participants, resulting in a sample size of 572 respondents. The study utilized various statistical tools for data analysis. Reliability of the instrument was confirmed using Cronbach’s Alpha, while descriptive statistics provided an overview of respondent perceptions. Factor analysis, along with KMO and Bartlett’s tests, helped in identifying underlying service dimensions. Hypothesis testing was conducted through ANOVA, Tukey’s Test, Hotelling’s T-Squared Test, Welch Test, and the Brown & Forsythe Test to determine statistical significance across demographic groups. IBM SPSS Version 23.0 was used for all quantitative analyses.
Research Objectives
Statistic |
Value |
Interpretation |
Cronbach's Alpha |
0.782 |
Indicates good internal consistency. Values between 0.7 and 0.8 are considered acceptable to good, especially in social science research. |
Cronbach's Alpha Based on Standardized Items |
0.779 |
Very close to the raw alpha, showing that standardizing the items (e.g., converting to z-scores) doesn’t significantly change reliability. |
The reliability analysis of the scale measuring customer responsiveness in the Indian hospitality sector indicates a Cronbach's Alpha value of 0.782, suggesting good internal consistency among the 14 items included in the questionnaire. This value falls within the acceptable to good range, implying that the items reliably measure the underlying construct. The alpha value based on standardized items (0.779) is nearly identical, indicating that item standardization does not significantly impact the scale’s reliability. Overall, the results confirm that the instrument used for data collection is both consistent and dependable for further analysis.
Hotelling's T-Squared Test
Table 4
Hotelling's T-Squared Test |
||||
Hotelling's T-Squared |
F |
df1 |
df2 |
Sig |
1534.436 |
115.553 |
13 |
559 |
.000 |
The results of Hotelling’s T-Squared test (T² = 1534.436, F = 115.553, p < .001) indicate a statistically significant difference in how respondents perceived the combined influence of 13 service-related factors within the Indian hospitality sector. The highly significant p-value leads to a rejection of the null hypothesis, suggesting that customers do not evaluate all service attributes equally. Instead, certain elements—such as staff friendliness, responsiveness, reservation efficiency, and loyalty benefits—are perceived as more impactful in shaping customer satisfaction and decision-making. This finding underscores the need for hotel managers and entrepreneurs to strategically prioritize high-impact service dimensions. Investing in responsive customer service, personalized loyalty programs, and staff training can significantly enhance customer satisfaction, retention, and competitive advantage in a highly differentiated market.ANOVA with Tukey's Test for Nonadditivity
Table 5
ANOVA with Tukey's Test for Nonadditivity |
|||||||
|
Sum of Squares |
df |
Mean Square |
F |
Sig |
||
Between People |
2354.750 |
571 |
4.124 |
|
|
||
Within People |
Between Items |
1842.170a |
13 |
141.705 |
1606.323 |
.000 |
|
Residual |
Nonadditivity |
89.676b |
1 |
89.676 |
100.907 |
.000 |
|
Balance |
6595.940 |
7422 |
.889 |
|
|
||
Total |
6685.616 |
7423 |
.901 |
|
|
||
Total |
8527.786 |
7436 |
1.147 |
|
|
||
Total |
10882.535 |
8007 |
1.359 |
|
|
||
Grand Mean = 3.4622 |
|||||||
a. Kendall's coefficient of concordance W = .169. |
|||||||
b. Tukey's estimate of power to which observations must be raised to achieve additivity = -.409. |
|||||||
The analysis of variance across 13 service attributes revealed significant perceptual differences among respondents. The Between People sum of squares (2354.750) reflects natural variation in individual preferences, while the highly significant Between Items F-value (F = 1606.323, p < .001) confirms that customers do not rate all service dimensions equally—certain factors are perceived as more influential in their hospitality experience. Additionally, Tukey’s Nonadditivity Test indicates a significant violation of the additivity assumption (F = 100.907, p < .001), suggesting that respondents’ ratings are interdependent—implying that satisfaction with one service aspect (e.g., reservation ease) may shape perceptions of others (e.g., staff behavior). The Kendall’s W coefficient of 0.169 reflects low to moderate inter-rater agreement, further reinforcing the diversity of customer expectations.
From a managerial standpoint, these findings highlight the need for differentiated service strategies that focus on high-impact attributes and recognize customer heterogeneity. Uniform service delivery may not address the nuanced preferences of Indian hospitality consumers. Instead, targeted investments in responsiveness, staff behavior, loyalty programs, and digital communication—tailored to distinct customer segments—can enhance satisfaction, loyalty, and market positioning in an increasingly competitive and diverse landscape.
Table 6
Ranking of CRM Elements Based on Mean analysis |
|||||
Rank |
CRM Elements |
Minimum |
Maximum |
Mean |
Std. Deviation |
1 |
24hrs communication facility required |
1.00 |
5.00 |
4.1151 |
1.13967 |
2 |
Influence of Speed Of Guest Service in Hotel Selection |
1.00 |
5.00 |
3.9266 |
1.11227 |
3 |
Staff should understand english as well as hindi |
1.00 |
5.00 |
3.7242 |
1.00759 |
4 |
Customer giving instructions to staff should be followed |
1.00 |
5.00 |
3.7123 |
1.08238 |
5 |
Staff should be friendly towards guest |
1.00 |
5.00 |
3.7103 |
1.00862 |
6 |
Staff should be trustworthy |
1.00 |
5.00 |
3.7083 |
1.01688 |
7 |
Staff should put their guest first |
1.00 |
5.00 |
3.6548 |
1.12617 |
8 |
Hotel should reply promptly |
1.00 |
5.00 |
3.4841 |
1.03408 |
9 |
Influence of other people opinion in hotel selection |
1.00 |
5.00 |
3.4821 |
1.09566 |
10 |
Influence of Reservation System in Hotel Selection |
1.00 |
5.00 |
3.4504 |
1.10373 |
11 |
Hotel should send seasons greeting to customers |
1.00 |
5.00 |
3.2798 |
1.00254 |
12 |
Any Discount and special offers can be a factor for reselecting hotel |
1.00 |
5.00 |
3.0774 |
1.12621 |
13 |
Influence of Loyalty Programs (Loyalty Points) in hotel selection |
1.00 |
5.00 |
3.0278 |
1.07900 |
Strategic Insights for Hospitality Businesses:
KMO and Bartlett's Test |
||
Kaiser-Meyer-Olkin Measure of Sampling Adequacy. |
.749 |
|
Bartlett's Test of Sphericity |
Approx. Chi-Square |
2026.195 |
df |
91 |
|
Sig. |
.000 |
|
The results of the KMO and Bartlett’s Test reflected in table 7 confirm the suitability of the dataset for factor analysis. The Kaiser-Meyer-Olkin (KMO) value of 0.749 indicates a moderate to good level of sampling adequacy, suggesting that the variables share enough common variance to justify the use of factor analysis. Additionally, Bartlett’s Test of Sphericity is highly significant (Chi-Square = 2026.195, df = 91, p < 0.001), indicating that the correlation matrix is not an identity matrix and that sufficient correlations exist among the variables. Together, these results validate that the dataset is appropriate for uncovering meaningful and distinct underlying factors through factor analysis.
Factor Analysis
Table 8
Rotated Component Matrixa |
||||
|
Component |
|||
1 |
2 |
3 |
4 |
|
Influence of Reservation System in Hotel Selection |
.734 |
.004 |
.205 |
.006 |
Influence of Speed Of Guest Service in Hotel Selection |
.830 |
.050 |
.031 |
-.023 |
Influence of Loyalty Programs (Loyalty Points) in hotel selection |
-.079 |
.767 |
-.030 |
.216 |
Influence of other people opinion in hotel selection |
.168 |
.647 |
.246 |
.022 |
Staff should be friendly towards guest |
.246 |
.614 |
.234 |
-.188 |
Hotel should reply promptly |
.381 |
.462 |
.309 |
-.079 |
Staff should be trustable |
.575 |
.071 |
.375 |
.266 |
Staff should put their guest first |
.678 |
.337 |
-.081 |
.179 |
24hrs communication facility required |
.424 |
.046 |
.772 |
.070 |
Staff should understand english as well as hindi |
-.110 |
.297 |
.752 |
.032 |
Customer giving instructions to staff should be followed |
.521 |
.443 |
-.026 |
.004 |
Hotel should send seasons greeting to customers |
.068 |
-.210 |
.223 |
.731 |
Any Discount and special offers can be a factor for reselecting hotel |
.093 |
.370 |
-.146 |
.748 |
Extraction Method: Principal Component Analysis. |
||||
a. Rotation converged in 9 iterations. |
||||
In this study, factor analysis was performed using Principal Component Analysis (PCA) with Varimax rotation to uncover the underlying dimensions that influence customer preferences in hotel selection and service expectations. The primary aim was to condense a broad set of interrelated variables into a more manageable and interpretable structure of components. The rotated component matrix presented in Table 8 revealed four distinct factors, each comprising variables that clustered together based on strong correlations. These components were interpreted and labeled as responsiveness, customer engagement, customer connectivity, and promotional appeal. Each of these factors captures a significant aspect of customer behavior and expectations within the hospitality context. The rotation process converged in nine iterations, indicating a stable and meaningful factor solution that can provide valuable insights for further statistical analysis as well as practical decision-making in hotel management.
Hypothesis Testing
Association Between Customer Demographics and Perceived Responsiveness in the Hospitality Sector
In this study, a set of null hypotheses was framed to examine the relationship between demographic variables and the identified CRM element, Responsiveness. These hypotheses aimed to determine whether customer perceptions of responsiveness in the hospitality sector differ significantly based on demographic characteristics. Table 9 reflects that the study proposed no significant association between responsiveness and gender (H1.1), age (H1.2), marital status (H1.3), educational qualification (H1.4), occupation (H1.5), and family annual income (H1.6). Each hypothesis tests the assumption that customer responsiveness is perceived uniformly across these demographic segments. By statistically testing these associations using Chi-square tests and effect size measures such as Cramer's V and contingency coefficients, the study sought to identify whether these demographic factors meaningfully influence how customers evaluate responsiveness from service providers in hotels. The rejection or acceptance of these null hypotheses provides insights into whether tailored CRM strategies are needed for different demographic groups, thus aiding in more targeted and effective service delivery.
Table 9
Hypothesis Statement - Demographic variables with Perceived Responsiveness Elements |
|
Hypothesis |
Statement |
H 1.1 |
There is no significant association between Responsiveness and Gender |
H 1.2 |
There is no significant association between Responsiveness and Age |
H 1.3 |
There is no significant association between Responsiveness and Marital Status |
H 1.4 |
There is no significant association between Responsiveness and Qualification |
H 1.5 |
There is no significant association between Responsiveness and Occupation |
H 1.6 |
There is no significant association between Responsiveness and Family Annual Income |
Hypothesis Test
Table 10
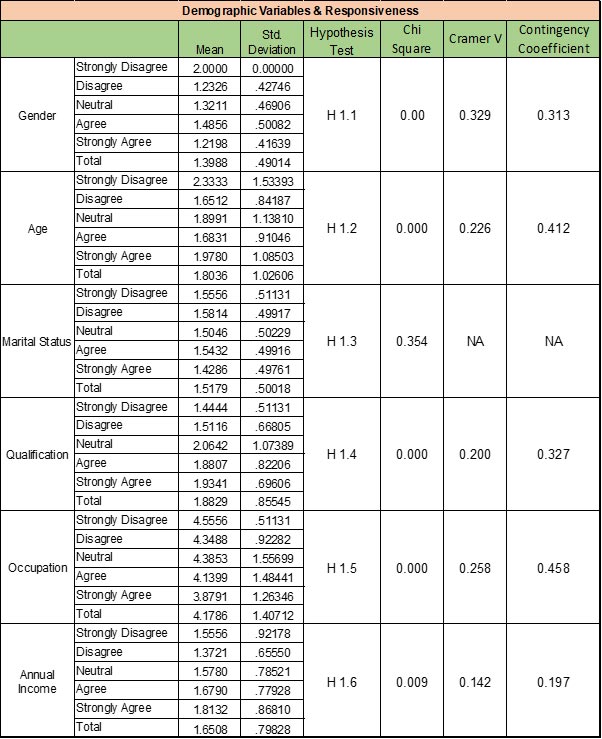
Hypothesis Test Interpretation
Chi-square tests reveal statistically significant associations (p < 0.05) between responsiveness and all demographic variables — Gender, Age, Education, Profession, and Income. This indicates that customer perceptions of responsiveness vary meaningfully across these groups.
Descriptive Statistics
These dimensions reflect different yet interconnected areas of service that drive customer expectations and preferences.
This study provides valuable insights into the multifaceted nature of customer responsiveness in the Indian hospitality sector. The research identified four core dimensions—responsiveness, customer engagement, customer connectivity, and promotional appeal—that collectively shape customer expectations and preferences. Statistical analyses confirmed that customers do not view all service attributes equally; instead, certain factors hold greater influence in their hotel selection and satisfaction. Additionally, demographic variables such as gender, age, education, profession, and income significantly affect perceptions of responsiveness, although with moderate effect size. The low inter-rater agreement highlights diverse customer preferences, reinforcing the need for personalized service strategies. The interaction among service factors suggests that hospitality managers should adopt a holistic approach to service improvement rather than isolated interventions. The findings emphasize balancing technology with human touch to meet evolving customer needs in a competitive market. Overall, this study offers actionable insights for hotel managers aiming to enhance customer satisfaction and loyalty through targeted responsiveness initiatives.
Implications