Subscribe now to get notified about IU Jharkhand journal updates!
Impact of Trade Liberalisation on Agricultural Products in India: A Comparative Analysis of Pre and Post Reform
Abstract :
This paper aims to investigate how the ‘liberalisation of trade’ which is a part of the global synchronisation namely LPG (Liberalisation, Privatisation, and Globalisation) has affected the trend, composition, and pattern of trade in agricultural products in India, by studying 34 years of performance during the post-reform period (1990-91 to 2013-14) and the immediate pre-reform period (1980-81 to 1989-90). It demonstrates that the post-reform period has been characterized by an acceleration in the growth rate of production of tradable agricultural products as well as increasing trend in its share in total national trade. The results are empirically tested with simple descriptive statistics like dummy variable regression model and annual growth model with the help of different variables and their ratios like TAP to TT, TAT to TT, TAT to GDP at factor cost, agricultural export and agricultural import. The economic interpretation of the result reveals that there is positive ascendancy over the concerned ratios and the share of agricultural trade to Total Trade has been increasing in the post-reform period. But in the face of global competitiveness and a shortage of food grains in the domestic market, it is becoming hard to maintain a constant level of contribution in export and earn a surplus in agricultural trade. More solid and consistent trade policies needed to be initiated in order to reap the benefit out of trade liberalization on our primary sector.
Keywords :
Trade liberalisation, Agricultural export and import, 1991 ReformIntroduction :
It is a saying that, “Everything Else Can Wait but Not Agriculture.”
LPG (Liberalisation, Privatisation, and Globalisation) is the new buzzword that has come to the world since the dawn of the nineties of the last century.
Liberalisation as a part of this worldwide phenomenon (LPG) has become a major component in the reform process of the Indian economy in the year of 1991,
July 24 with the introduction of New Reform Policy. Liberalisation has initially been employed in the trading sector to bring out changes, but soon has spread
and grabbed another sphere of the economy as well. Agriculture is the backbone of Indian society and considered as the primary sector in Indian economy. Thus it
is important to study the growth and development of agriculture when the economy is changing through this new phenomenon of trade liberalisation. Liberalisation
can be defined as “complete freedom of enterprise, reduction in government regulations for economic activities to the minimum and reduction in tariffs and taxes.”
In the light of this definition, agricultural trade is already been liberalised. From the pre-British period, India was quite famous for foreign trade and was
always a nation of primary products exporter. However, the pattern of trade in the agricultural sector has been changed and this reform process had brought new
opportunities for trade in the agricultural sector in India.
1.2 Theoretical Background :
India needed a reform of her agricultural policy-measures as her productivity in agriculture is far below the level of the world’s average. India ranks 15th in the paddy production
(2145 kg/ha against the world average of 2340 kg/ha), 11th in the wheat production (2032 kg/ha against the world average of 2340 kg/ha), 13th in the maize production
(1355 kg/ha against the world average of 3656 kg/ha) and 14th in the pulse production (544 kg/ha against the world average of 807 kg/ha) before 1991. History says that a marked rise
in agricultural production always preceded by industrial development. Revolutionary changes in agriculture can bring about a viable base for modern industrial structure in India.
Mr. B.B. Ramaiah, the union minister of state for commerce, had announced a five year Ex-Im policy (1997-2002). This policy significantly cut down the list of quantitative
restriction on imports as well as exports, simplifies procedures, and provides special incentives for trade in agricultural products. Among the two-thirds of the items which are
removed from the restricted list to Special Import Licence (SIL) and Open General Licence (OGL) lists, some agro-products such as corn flakes, coffee, edible gums etc were the
important one. The policy aims at consolidating and tries to restructuring the schemes to achieve further gains from the liberalisation of trade in agricultural products.
The national income from agriculture has risen from Rs. 58,921 cores in 1990-91 to 60,934 cores in 1993-94 (1.1% per annum). The food grains production of 21.4 million tonnes
in 1991-95 has increased by 189.8 million tonnes in 1994-95 in just four years. India had a 0.6% of total world trade in agricultural products. Liberalisation of trade may involve
a rise in the domestic relative prices of food grains by about 15 to 20%. [WB Report: 2000].
1.2.1 Impact of Trade Liberalisation on Agriculture
It has been one of the principal aims of the government from the beginning of the first Five Year Plan to raise the share of agricultural products in national trade. To ensure free
trade and trade openness facilities in agricultural products, several steps have been taken to keep pace with the growing competition created by trade liberalisation. Some of them
are, (i) Many of the quantitative restrictions on agricultural trade have been dismantled and decanalised. (ii) The government has recently allowed hedging of agricultural products
in global exchanges.
(iii) The government has amended the Forward Market Commission and freed the agricultural prod4ucts, to let them enter into the international markets.
Opening up of agricultural trade, among various possibilities, can bring major economic acceleration by exploiting the comparative advantage in the agricultural sector in India. By
granting the farmer access to world markets, can increase his incentive to invest in the farming. An important thing to notice is that as the import content of agricultural sector
in Total Trade (hereafter TT) is insignificant in comparison to the non agricultural sector, the total gains from trade as well as foreign exchange earned through agro-export, is
more.
1.3 Setting objectives for the study
- While the era of reform was establishing a new economic foundation, the agricultural trading was also in the process of simultaneous change through the help of liberalisation. Therefore it has become necessary to study that “how liberalisation of trade had affected the trend, share, composition and pattern of trade in the agricultural products, by comparing the pre and post liberalisation or reform period”. It starts on the foundation of two research questions viz. one is “what is the performance of the agricultural product in the field of trade after being influenced by trade liberalisation?” And second is “how the pattern and composition of agricultural trading products change over time after trade liberalisation?” Based on these said research questions, the following two important objectives are taken in the paper.
- To measure the influence of trade liberalisation on total agricultural trading products
- To examine how trade liberalisation had affected the composition and pattern of trade in agricultural products
The paper has been organized into 5 sections. Besides the section-1 of introduction, section- 2 deals with the review of the works of literature focusing on nature of the relationship between liberalisation of trade and agricultural production. Section-3 is the brief description about the variable, data sources and proposed methodology used in the analysis. The empirical analysis is explained in section-4. Lastly, the section-5 concerns with the concluding remarks and suggests certain policy implications of the results derived from the present research.
2.1 Reviews of Literatures
The review in this study is restricted mainly to the literature on the impact of trade liberalisation on the agricultural sector. There are also studies at international level,
comparing the developed as well as developing countries and studies at the national level. However, with respect to the timeframe, the methodology employed, the nature of data used,
the number of variables examined and the estimation procedures adopted, the conclusion of the studies varied widely. The studies reviewed are arranged in chronological order so that
it enables us to trace their historical evolution, the improvement in data coverage and estimation procedure, which contribute to the stock of knowledge for researching this study.
The review of voluminous works of literature those are available on the liberalisation of trade and its impact upon Indian agricultural products reveal a strange mixture of outcomes.
Here, some of the most relevant works of literature, which focus on positive, negative or both sides of the said relationship, are critically analysed below.
2.1.1 The International Scenarios:
Many variations have been found in the researches done in different developing nations. Brandao and Will Martin (1993) had viewed that, the policy of trade liberalisation imposed a positive impact on the developing economies. Tengku Ahmad, Tawang (1999) as well as Vyas (1996) had tried to find the effects of agricultural trade liberalisation and the issues faced by the policymakers in certain developing countries of Asia. Bureau, Jean, and Matthews (2005) gave very different views suggesting that the impact of agricultural trade liberalisation on developing economies is very unequal. They had found a negative growth trend in agricultural trade over the last few decades after liberalising the trade in agricultural commodities. Giving suggestions Maralusiddaiah et al (2015) suggested that, India has to be carefully guiding its course in order to reap the benefits out of trade liberalisation in the agricultural sector.
2.1.2 The National Scenarios:-
Hanumantha Rao and Ashok Gulati (1994) has also agreed on their findings and reckoned that Indian agriculture is moving in a positive direction towards a new era because of
economic reforms and opening up of Indian agriculture into the global market. For achieving this, they suggested broad policy changes as well as a major reform on the supply
side. Parikh et al. (1995) have examined the impacts of liberalisation, reduction of input subsidy and safety net programmes for Indian agriculture after the New Economic Policy
was initiated in 1991 and found an astonishing result that trade liberalisation in non-agricultural sector is more important for agricultural growth than the trade
liberalisation in the agricultural sector. Similarly, Srinivas (1996) analysed the emerging global trade regime and liberalisation of trade and he found a negative impact of
trade liberalisation on the sustainability of agriculture. Misra (1998) discussed both the positive and negative effects of globalisation on Indian agriculture from pre-reform
(green revolution) period to post-reform till 2006-07 and found a favourable effect of liberalisation on the trade of agricultural commodities. Chand Ramesh (1999) found that
liberalisation leads to an opposite or inverse impact on consumer and producer surplus and it earned negative gains from trade with a loss of social welfare.
Meanwhile, Nayyar et al. (1994), Deshpande et al (2004), Ranga Reddy et al (2008), did a comparative study of pre and post-reform period and discovered that performance of the
primary sector’s contribution in trade for long-term was quite satisfactory during the period of globalisation but it led to a conclusion of bad performance during the nineties
while comparing the aggregate growth analysis. They discussed the macro level changes (positive and negative sides) of globalisation on Indian agriculture. Moreover, Krishna
Kumar et al (1995), giving emphasis on export of ‘tea’ showed a supply and price relationship between essential agricultural commodities. Bhalla (1996) introduced a negative
growth trend of liberalisation on agricultural trade through examining the demand and supply of agricultural commodities in general and some other commodities like food grains
in particular, in domestic as well as in international market. Likewise, Gulati et al (1997) found that India can reap significant gains from trade liberalisation if it frees up
imports and exports of agricultural products at zero duty. But, Minocha (1995) pointed out that the trade policies of the government had always discriminated against agriculture.
In addition, Vaidyanathan (2000) supported this argument and described the inefficiencies of Indian economy and her incapability of drawing any benefits from the process of
liberalisation.
Here some of the works of literature advocated that there is the positive association between trade liberalisation and agricultural trade by following a well-defined mechanism.
They were of saying that trade liberalisation had a positive impact on the export-import indicators of the Indian economy through discarding bans on international trade, farm
subsidies, market reforms, and liberalisation of farm input sector, an adaptation of agricultural export promotion & agricultural import substitution etc. Other literatures were
there which argued the negative compatibility of said variables. They prescribed the ways of heavy export of agricultural raw materials, heavy import of agricultural proceed
items, the departure of agricultural item manufacturing units from the market due to tight competition in the global market etc, by which the trade liberalisation had affected
the agricultural trading scenario unfavourably.
After discussing these kinds of arguments, it can be summarised that there is no concrete link between the concerned variables. Thus, the impact of trade liberalisation on
agricultural products was very inconclusive, un-simplified as well as conditional so far.
3.1 Variables, Data Base and Its Sources:
The present study comprises annual time series data on the variables like Total Agricultural Trade (hereafter TAT), the total volume of national trade or Total Trade (TT), growth rate of GDP (proxy for economic growth) as well as Agricultural Export (AE) and Agricultural Import (AM) of different crops. The study also includes three critical and proxy variables like TAT to GDP ratio, TAT to TAP ratio and TAT to TT ratio in order to capture the influence of trade liberalisation on total agricultural trading products. The dataset has been sourced from the secondary database namely Planning Commission of India, Indiastat, Hand Book of Statistics (RBI), Ministry of Agriculture (GoI), Directorate General of Commercial Intelligence and Statistics. The data comprises of the periods of 34 years spanning from 1980-81 to 2013-14, classified on the basis of pre-reform (1980-81 to 1990-91) and post-reform (1991-92 to 2013-14) period.
3.2 Specification of Methodology:
So far as the methodology to be applied in the current study is concerned, the simple descriptive statistics (both graphical and tabulation) formulas are employed in order to
examine the trend, pattern, and composition of different critical variables. For empirical analysis, the dummy variable regression model and its estimation with Ordinary Least
Square (OLS) and annual growth rate model have been used in order to determine the statistical significance of trade liberalization on different variables.
The section-2 explained some description about the data sources and methodology, which is to be employed to give an empirical touch to the theoretical nexus of the interesting
variables, inflicted in the study.
3.2.1 Dummy Variable Regression Model:
Dummy variable model can be of two types, ANOVA and ANCOVA. Regression models that contain only dummy explanatory variables are called analysis-of-variance (ANOVA) model. On the
other hand, a model is said to be ANCOVA, if the regression equation carries both quantitative and qualitative explanatory variables. The operation and usability for dummy
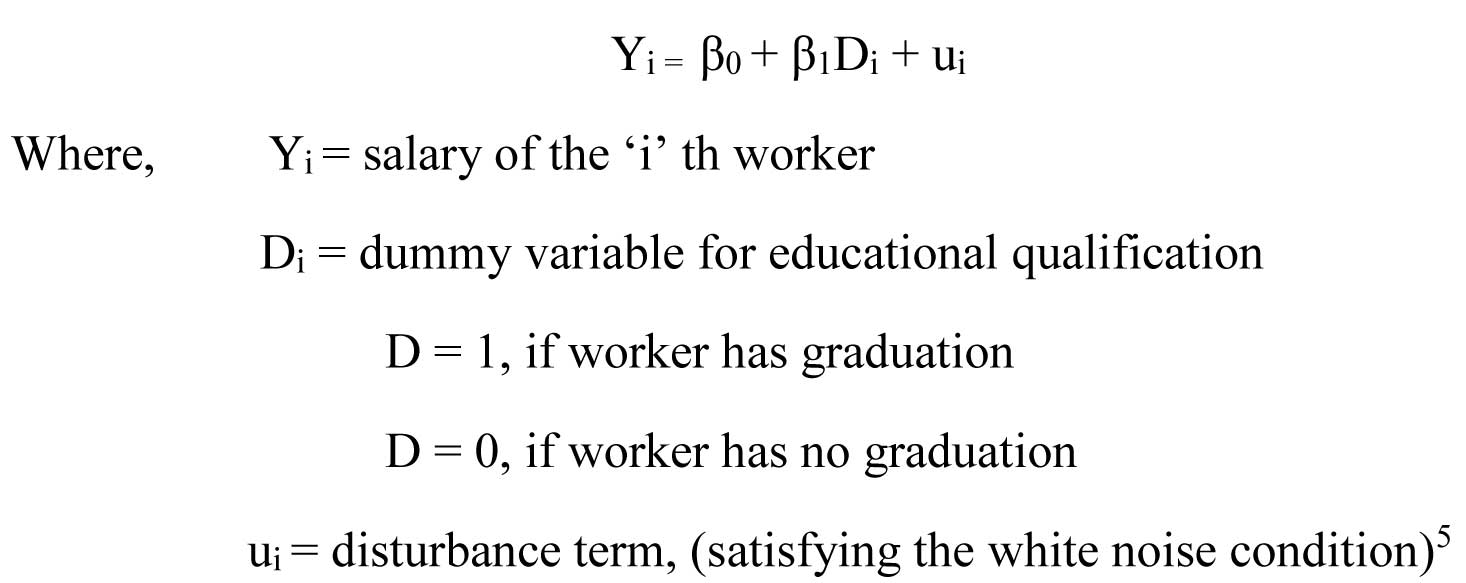
variable analysis can be explained by a simple example. Let us take an example of simple dummy variable regression model implying a relationship between salary ‘Y’ and
graduation ‘X’. It is assumed that the salary offered is the function of the educational qualification of the workers, i.e. higher payment with higher qualification. In order
to capture the influence of qualification differentiation of the salary payment, the following regression should be run,
3.2.2. Annual Growth Model:
Our Growth Model (4) is as follows:-
Log(Y) = C1 + C2 (T) + e ......................................... (4)
Here, Y = Sales Volume (in dollar) but in converted to log
C1 = constant
C2 = coefficient
T = Time period, 1980 to 2013
e = residual
The equation (4) is a semi-log model as only one variable (in this case the dependent variable) is in log form.
What is the sales growth rate over time?:
This paper shall be estimating the equation (4) and to the residual tests. The estimated model (4) should not have serial correlation or auto correlation, residual should be free
from heteroscedasticity and residual must be normally distributed. In addition to this, residual of model (4) should be stationary. For testing the stationary, we shall be using
correlogram (Q statistics). Here,
Null Hypothesis (H0): Residual is stationary
Alternative Hypothesis (H1): Residual is not stationary
The estimation shows,
- There is no serial correlation.
- The residual is normally distributed.
- There is no heteroscedasticity.
- The residual is stationary.
4.0 Empirical Analysis
Here different empirical analyses are applied on different variables owing to address the stipulated objectives of the paper.
4.1 Section-1:In this section, the simple descriptive statistics (both graphical and tabulation) formulas are employed in order to measure the influence of trade liberalisation on total agricultural trading products over the periods of 1980-81 to 2013-14.
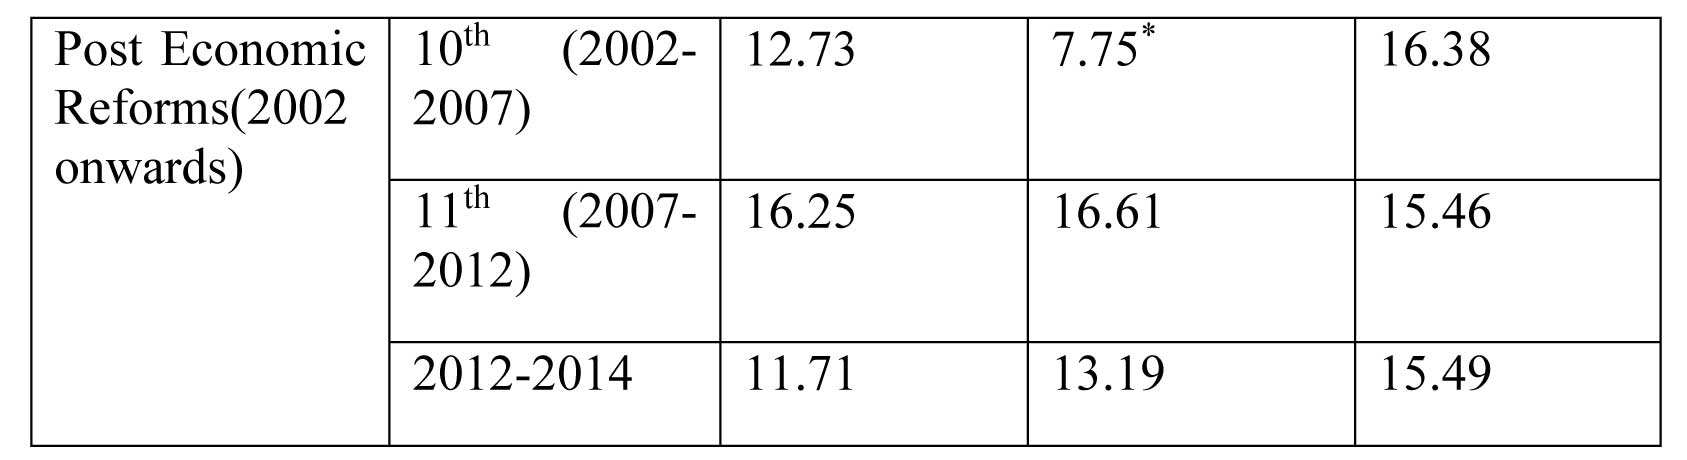
4.1.1 Analysis of Average Growth Rate of GDP and TAP:
 Source: Author’s Estimation
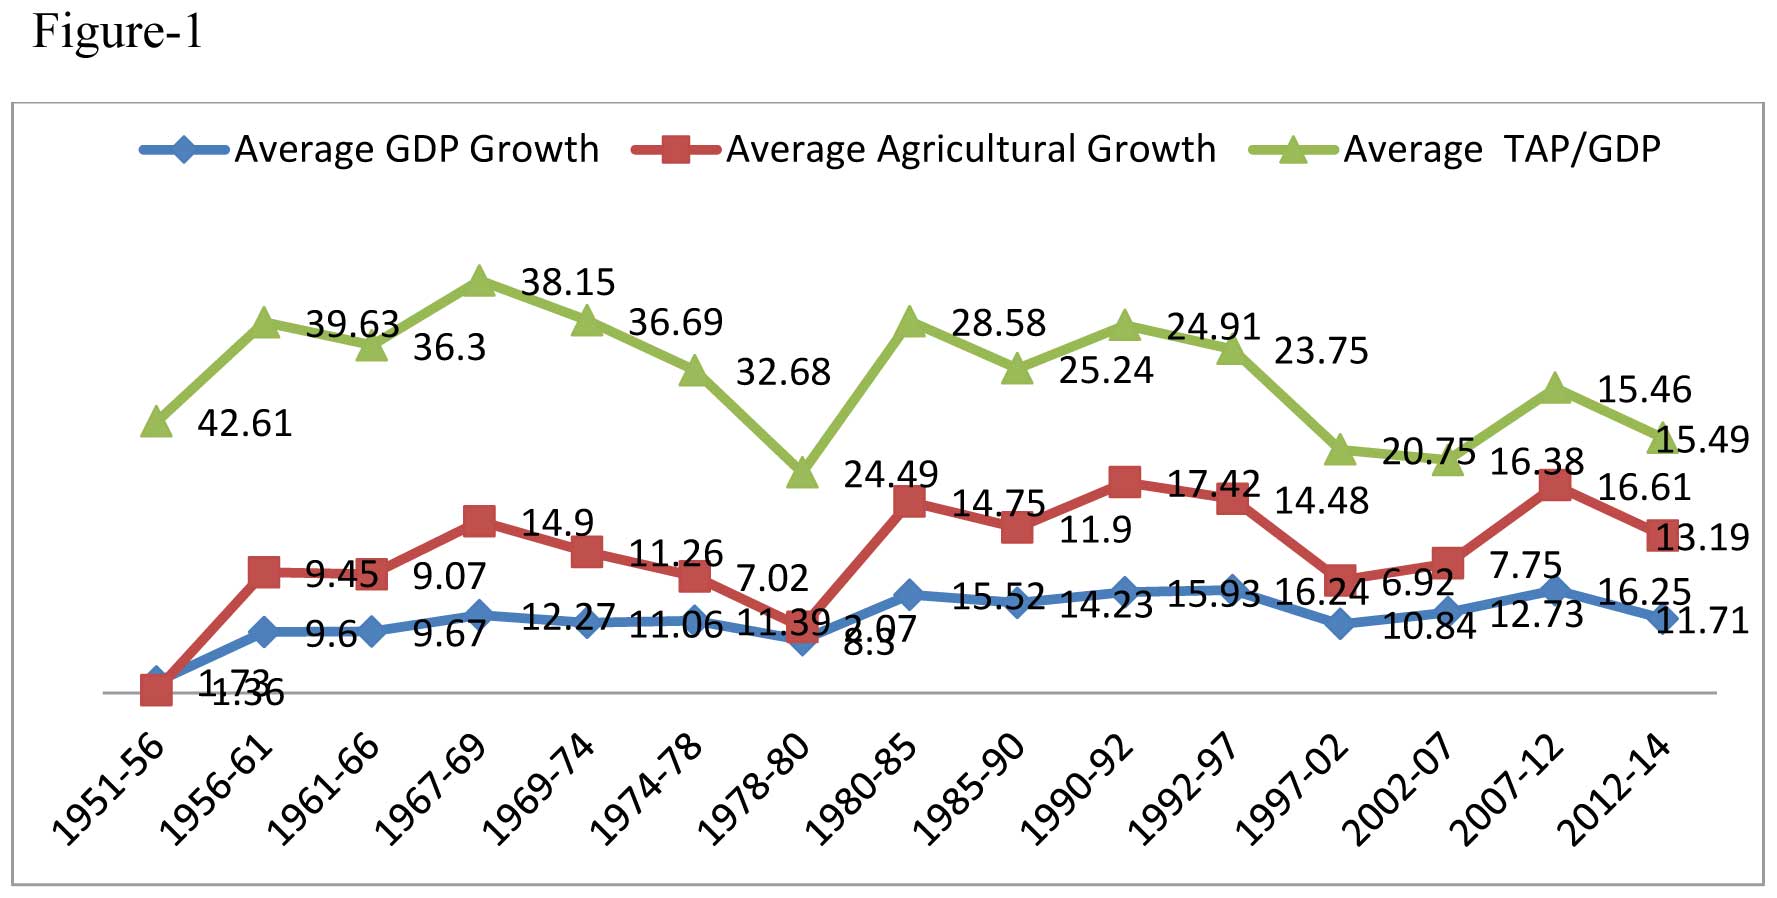
This first figure and appendix: table-1 reflects the trend of the average growth rate of GDP, agricultural products and the ratio of average TAP to GDP. It analysed the trend on
the basis of division of pre reform into phases of Green Revolution (GR), which are further sub-divided into planning periods. It shows that the Average Growth rate of GDP
increased from 1.73% in 1951-56 in pre GR to 12.27% in 1969-74 in early GR period. During the same time period, i.e. the 1st phase of GR, the average agricultural growth
increased at a much higher rate i.e. 14.9%. This becomes possible because of prioritising agriculture in the 1st FYP as well as for implementation of GR in Indian agriculture.
So that it becomes possible to reach the highest average growth ratio of Total Agricultural Product to GDP of 38.15%, in that 1st phase. After that period, in the 3rd phase of
mature GR period, both GDP and agricultural growth has gone down which leads to a fall in the ratio of Total Agricultural Trade (TAT) to GDP to 24.49%. Then the reform has
started and new policy of trade liberalisation has lead to a rise in the agricultural production which can be seen in the figure. The New Economic Policy (NEP) in Indian economy
was initiated with focusing on the development of agricultural sector by path of trade liberalisation.7 At the starting of 5th phase, the growth trend was not much significant
as it was again decreased to 15.49% by the end of 2012-14. Thus India has to be carefully guiding its course in order to reap the benefits out of trade liberalisation in
agricultural sector.
 Source: Author’s Estimation
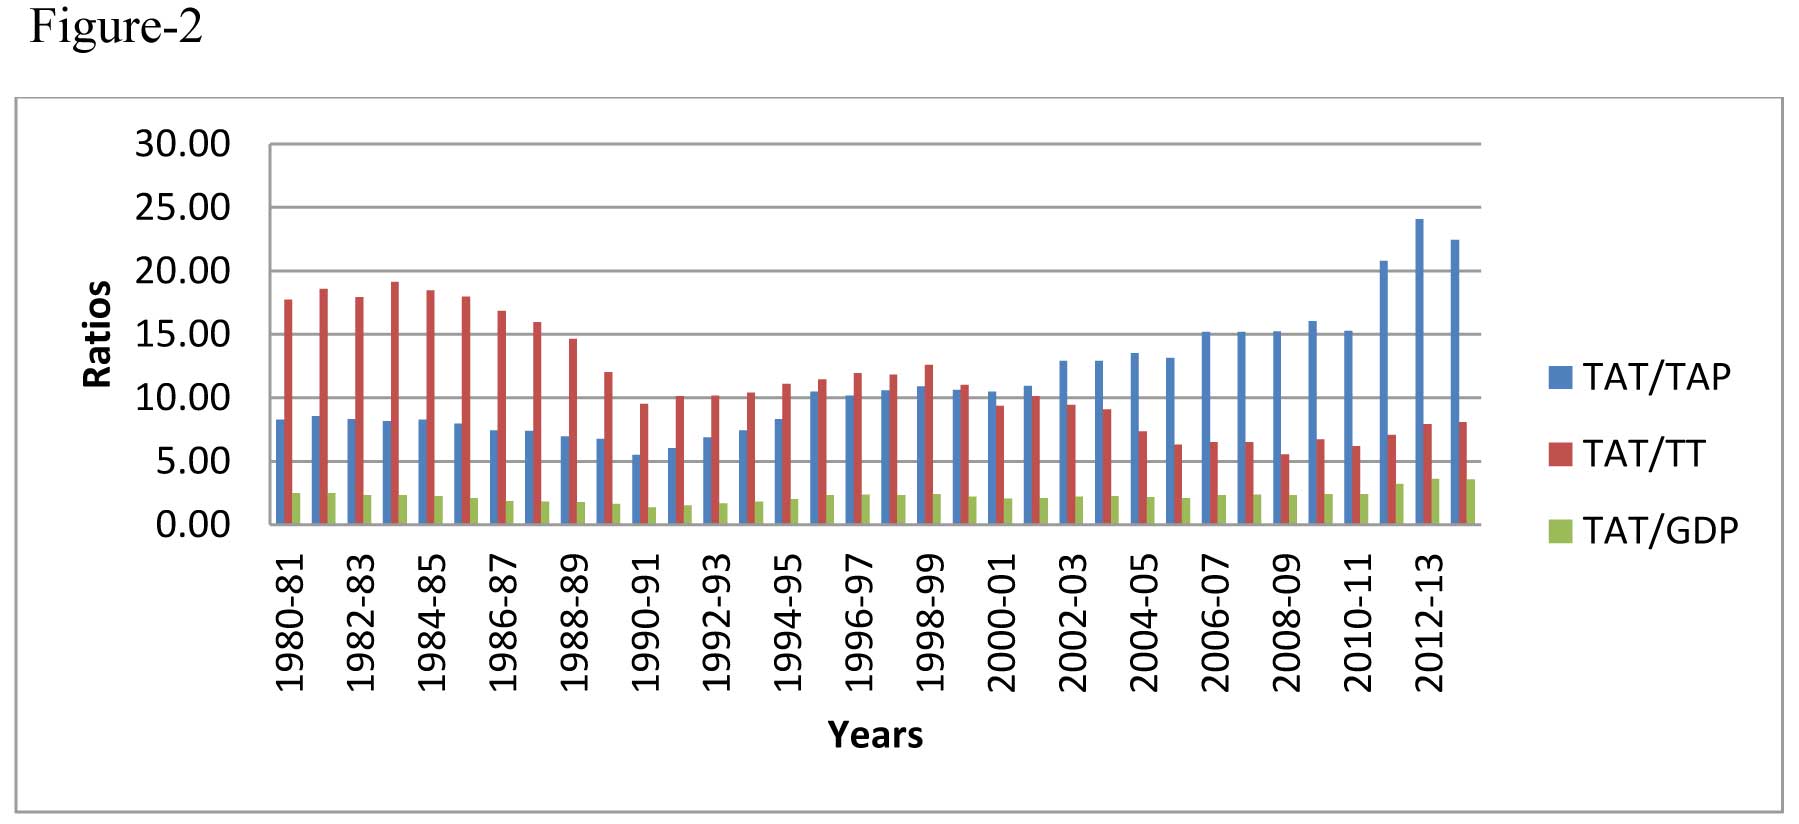
At the first look, the figure suggests that the ratio of TAT to TAP at the primary stage was down to 8.28%, which reached to 24.10% by the year of 2012-13. It only ever started
to fall in the mid-1980s and reached its minimum point in the year 1990-91 at 5% before the liberalisation. By liberalisation, the share of agricultural trade has always been
rising up in the post-Economic Reform period. Similarly, the ratio of TAT to TT in the figure indicates that it was just the opposite of the case of TAT to TAP. It was highest
at the primary stage and fall down afterward. This suggests that, although the ratio of agricultural trade to agricultural production is increased, the share of agricultural
trade to total trade is decreasing. The Economic Reform has touched other two sectors of the economy and increased the productivity more prominently than that of the primary
sector. Thus the ratio of TAT to GDP is also not very promising, which is also suggested by the figure. From the above analysis, it is cleared that the percentage of TAT to TT
is not very encouraging over the years. The figure demonstrates a downward trend about the share of agricultural products to the total volume of trade.
The present analysis takes TAT to GDP ratio, TAT to TAP ratio and TAT to TT ratio as proxy variables to be examined in order to know the previously mentioned performance. In addition, it will compute the presence of structural breaks in the series.
4.1.3.1 Dummy variable Estimation and its Results:
The three dummy variable equations of three different ratios can be written in the following manner.
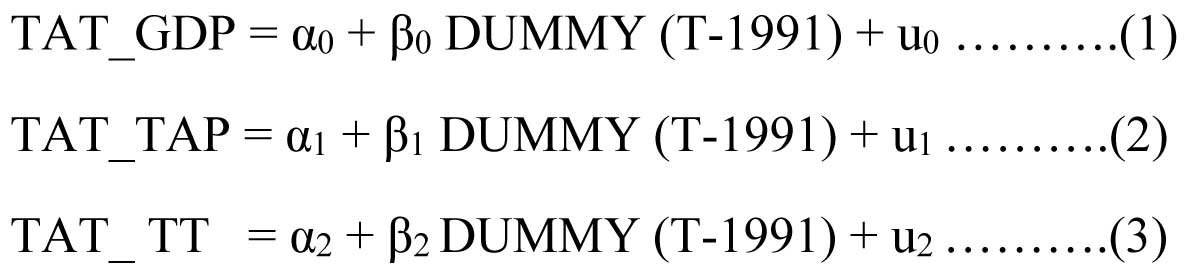
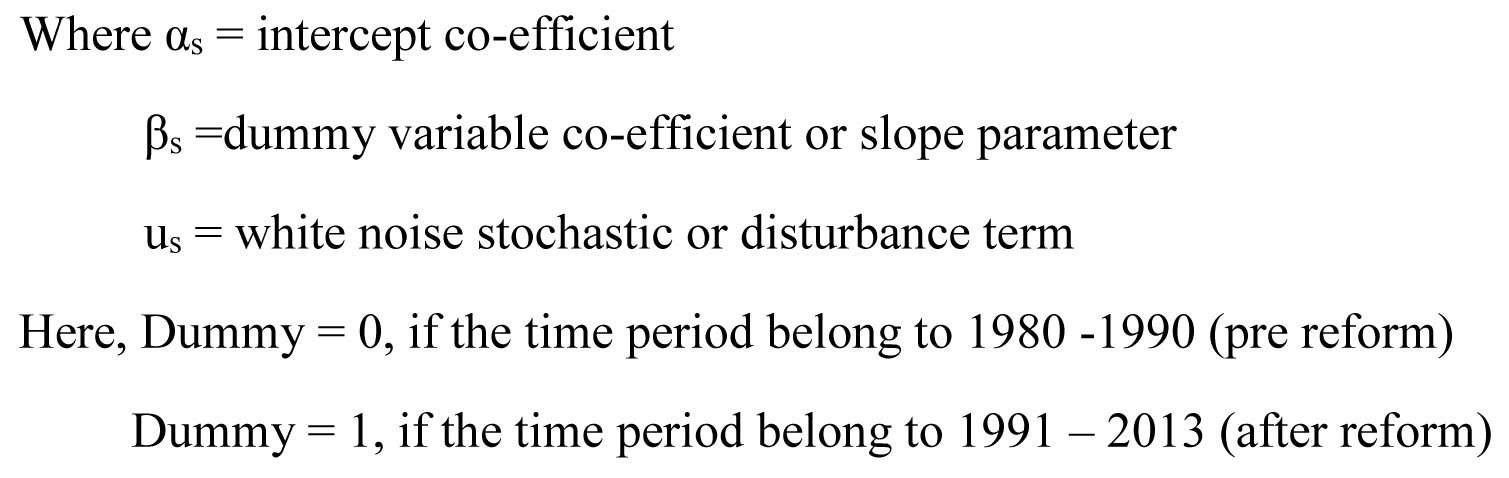
After performing ordinary least square method of estimation of dummy variable regression co-efficient, the following results tabulated in table-1 have been derived.
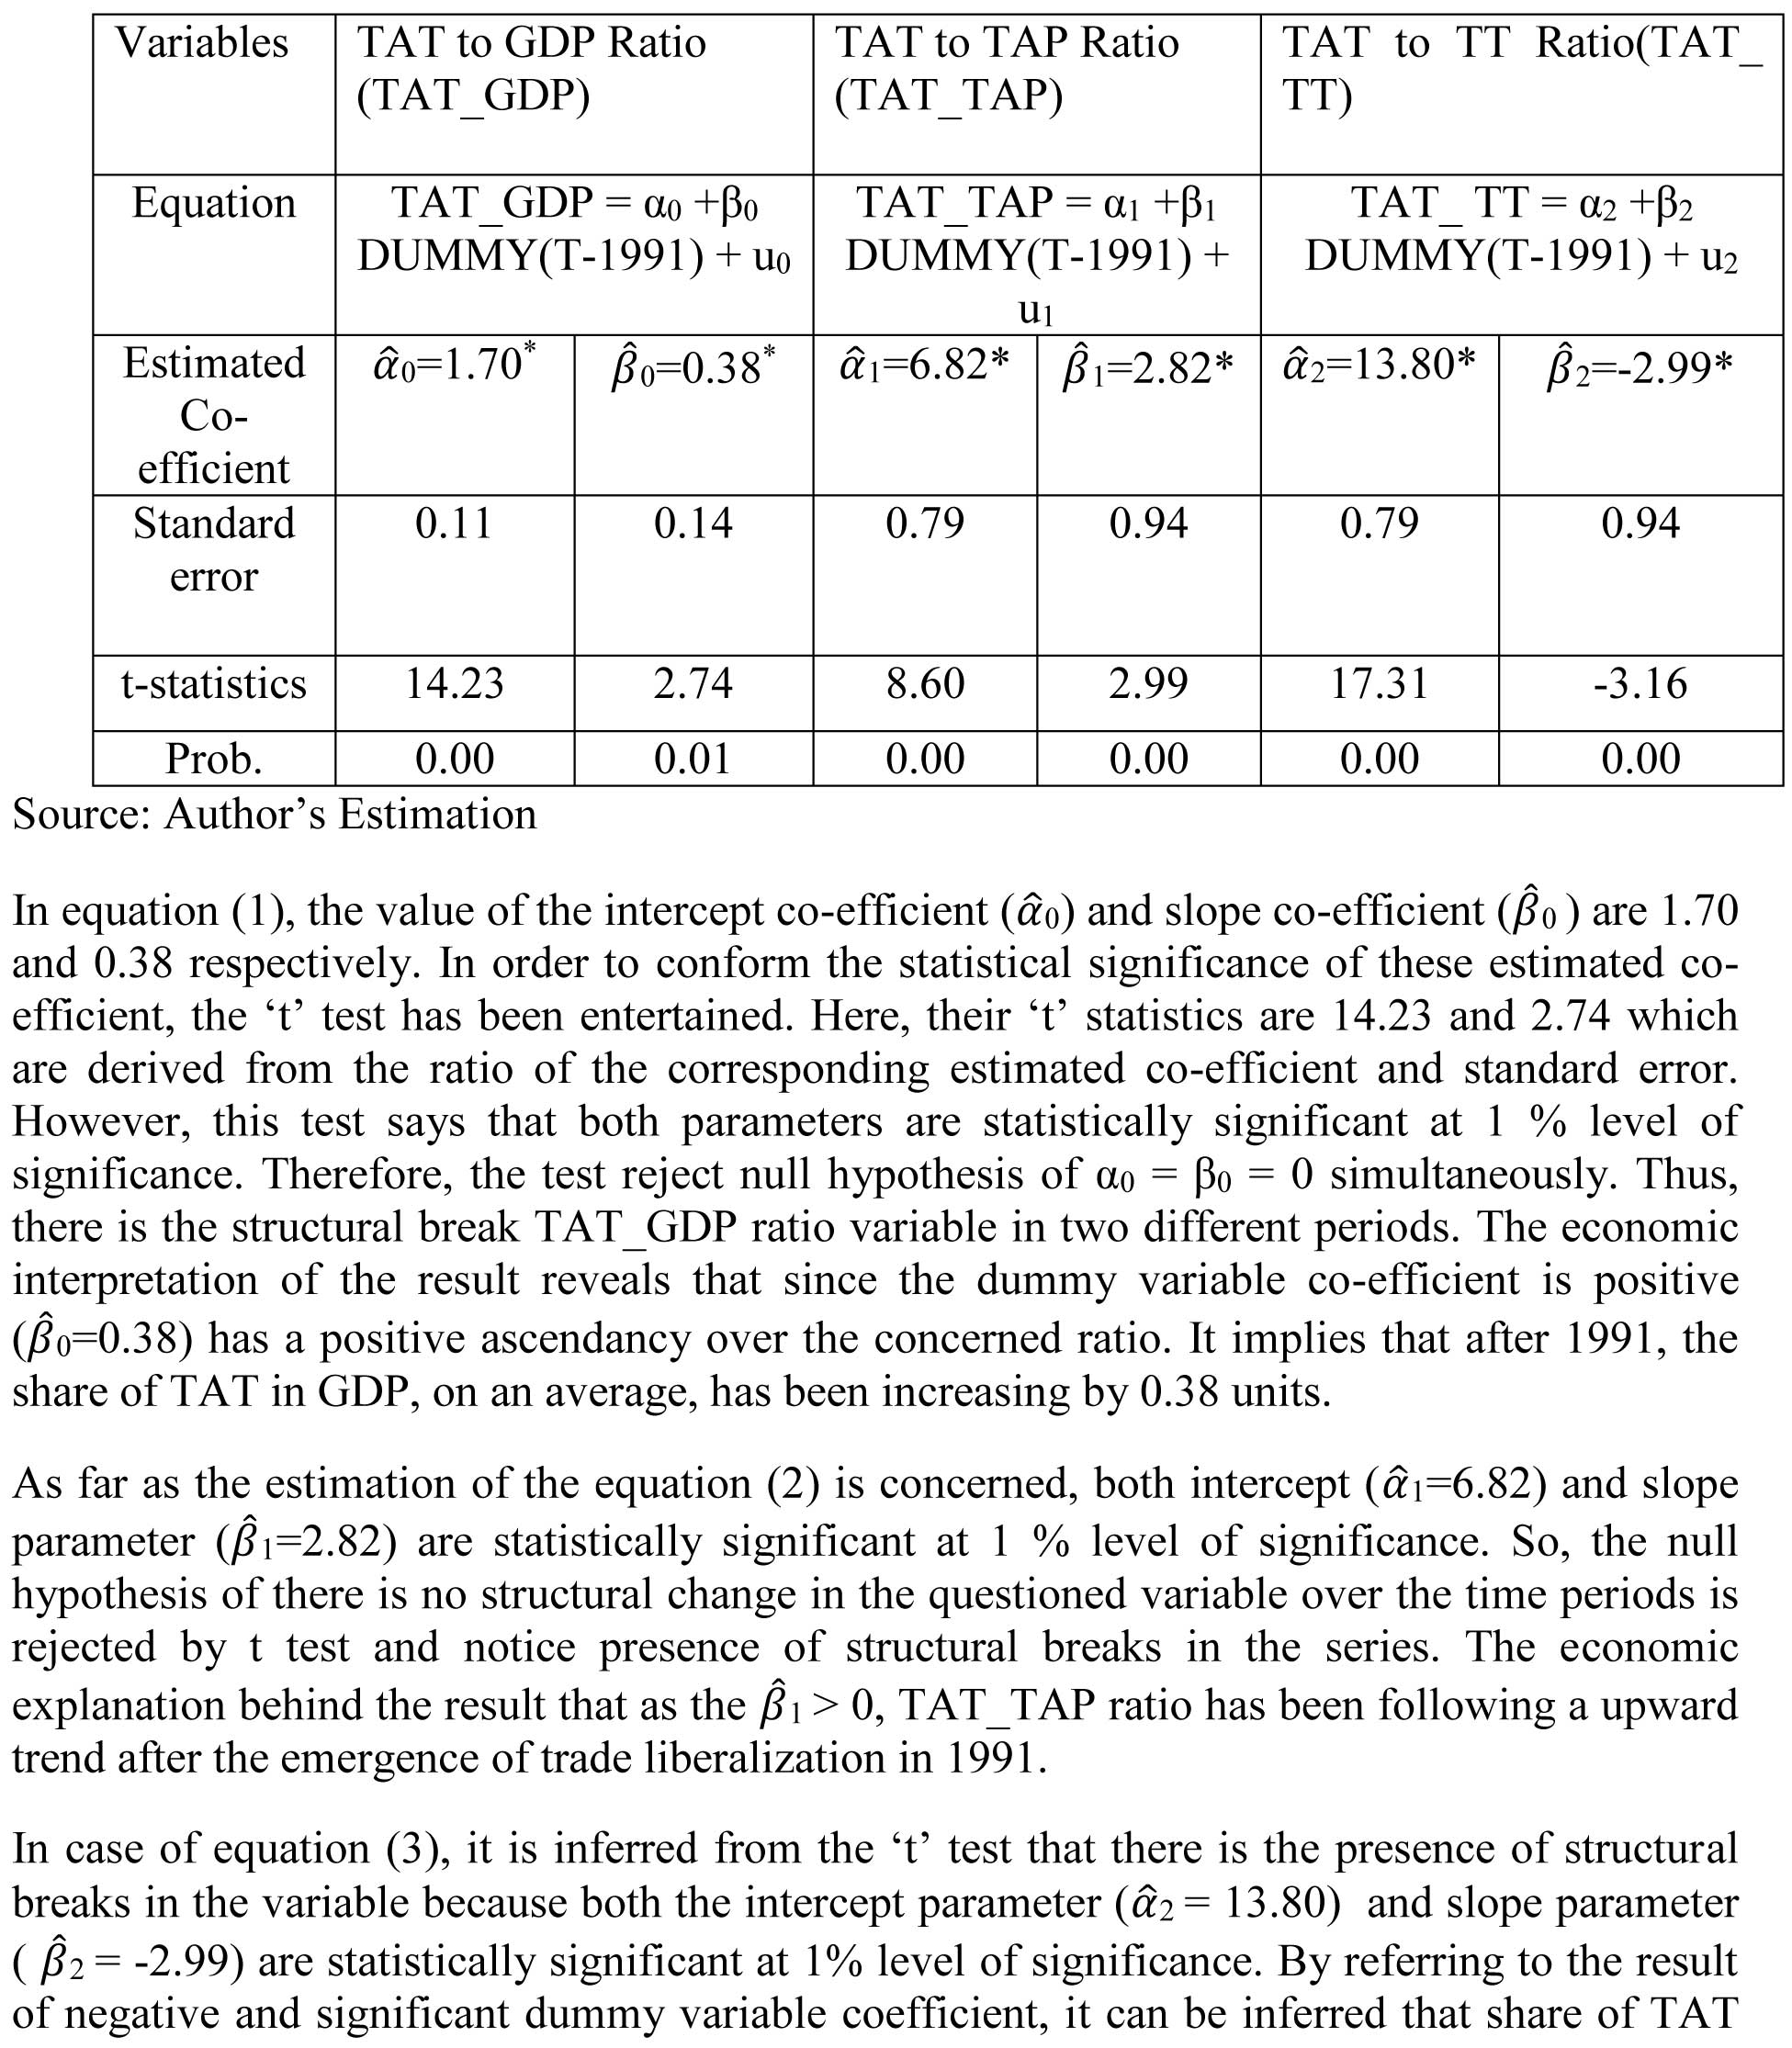
in TT displays a declining direction, implying negative impact of trade liberalization on TAT to TT ratio.
The Annual Growth rate shows the agricultural growth of a variable per unit change over the time. In the other word, the annual growth is nothing but it is per unit change in
average growth rate of a phenomenon over the time period.
Here, the four agricultural growth equations of the four variables of the study are given:
Log (GDP) = C1 + C2 (T) + u1 ............................. (4)
Log (TAT) = C3 + C4 (T) + u2 .............................(5)
Log (TAP) = C5 + C6 (T) + u3 ...............................(6)
Log (TT) = C7 + C8 (T) + u4 ..................................(7)
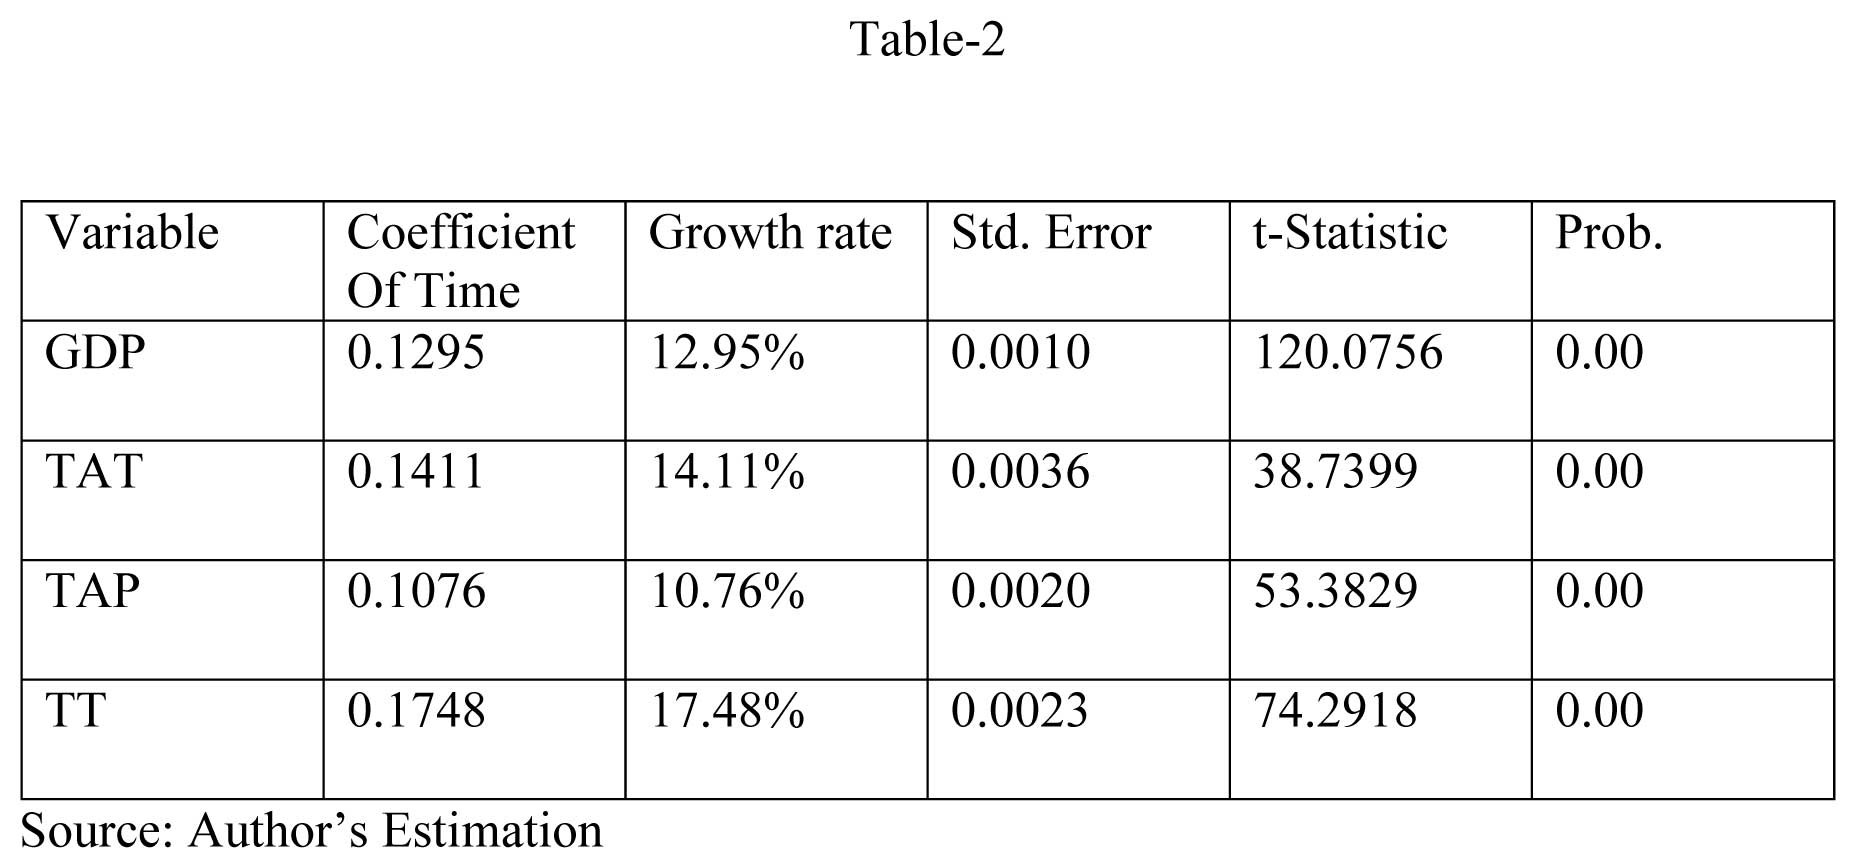
The analysis shows that, over the time period, the growth rate of TAT has been increasing than that of growth rate of GDP. Since the statistical significant growth rate of TAT (14.11%) is higher than the statistical significant growth rate of GDP (12.95%), it indicates definitely a positive sign of the development. Similarly, in case of TAT to TAP ratio, the growth rate of TAT is more (14.11%) than that of the growth rate of TAP (10.76%). It also gives statistically significant values and gives an impression of agricultural development. It shows that trade in agricultural product is more than that of agricultural production. But, in case of the ratio percentage of TAP to TT, the contribution of agricultural product to total trade is not significantly increasing. The growth rate of total trade shows 17.48% while growth rate of TAP is only 10.76%, which is not very encouraging, and it needs an improvement in its share.
4.2 Section-2
This section examines how trade liberalisation had affected the composition and pattern of trade in agricultural products, over the periods of 1980-81 to 2013-14.
4.2.1 Composition of Agricultural Trade:
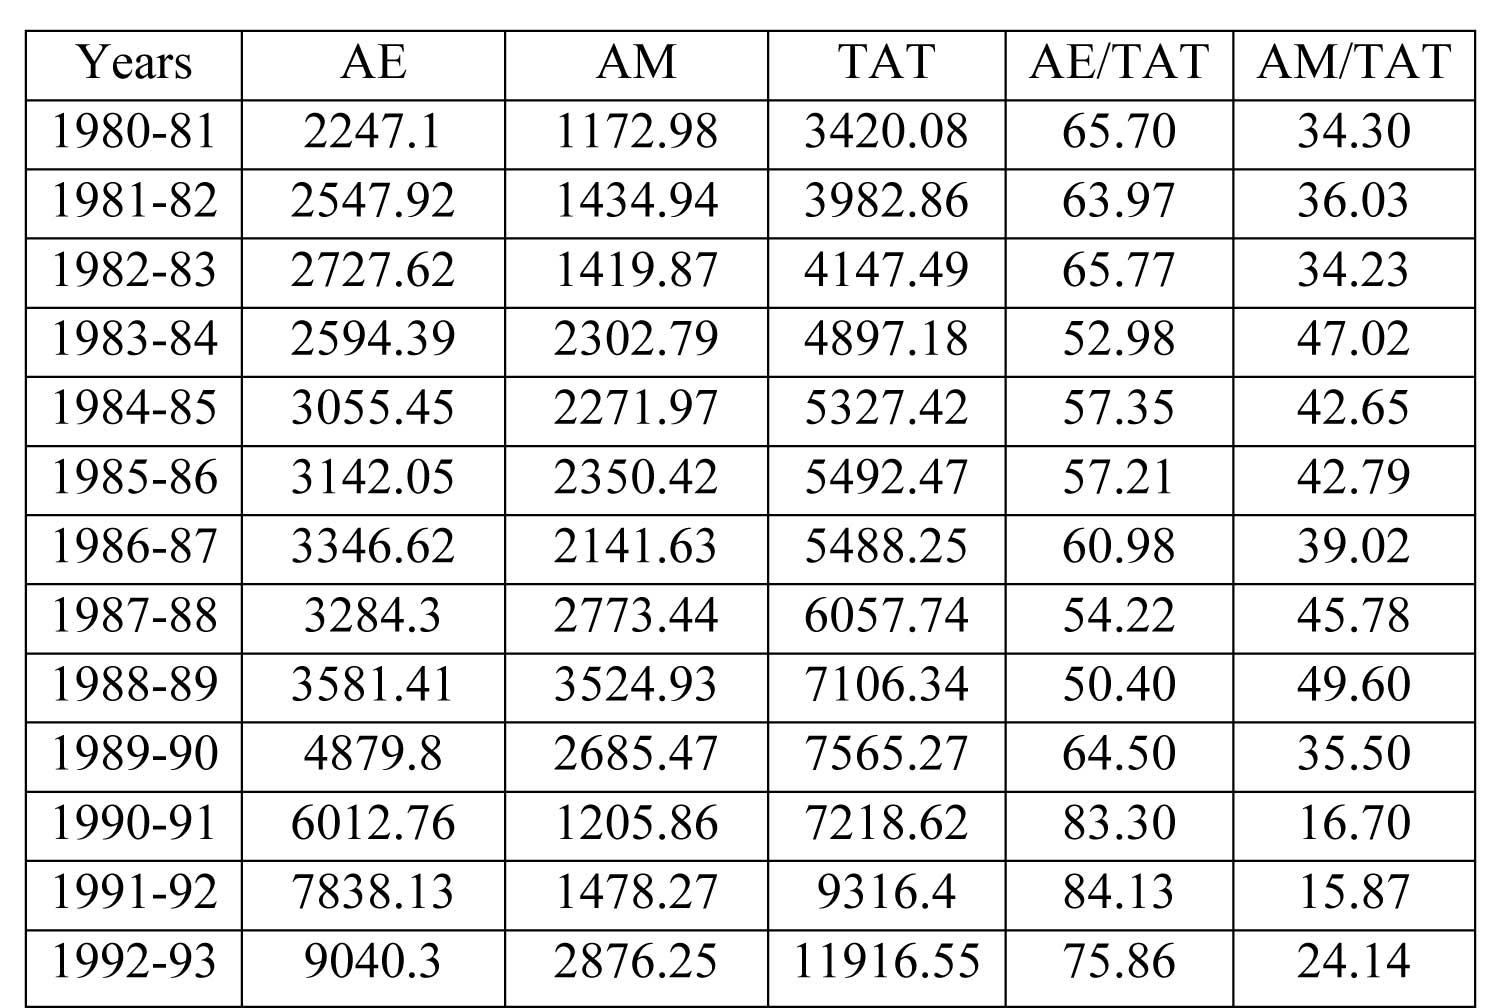
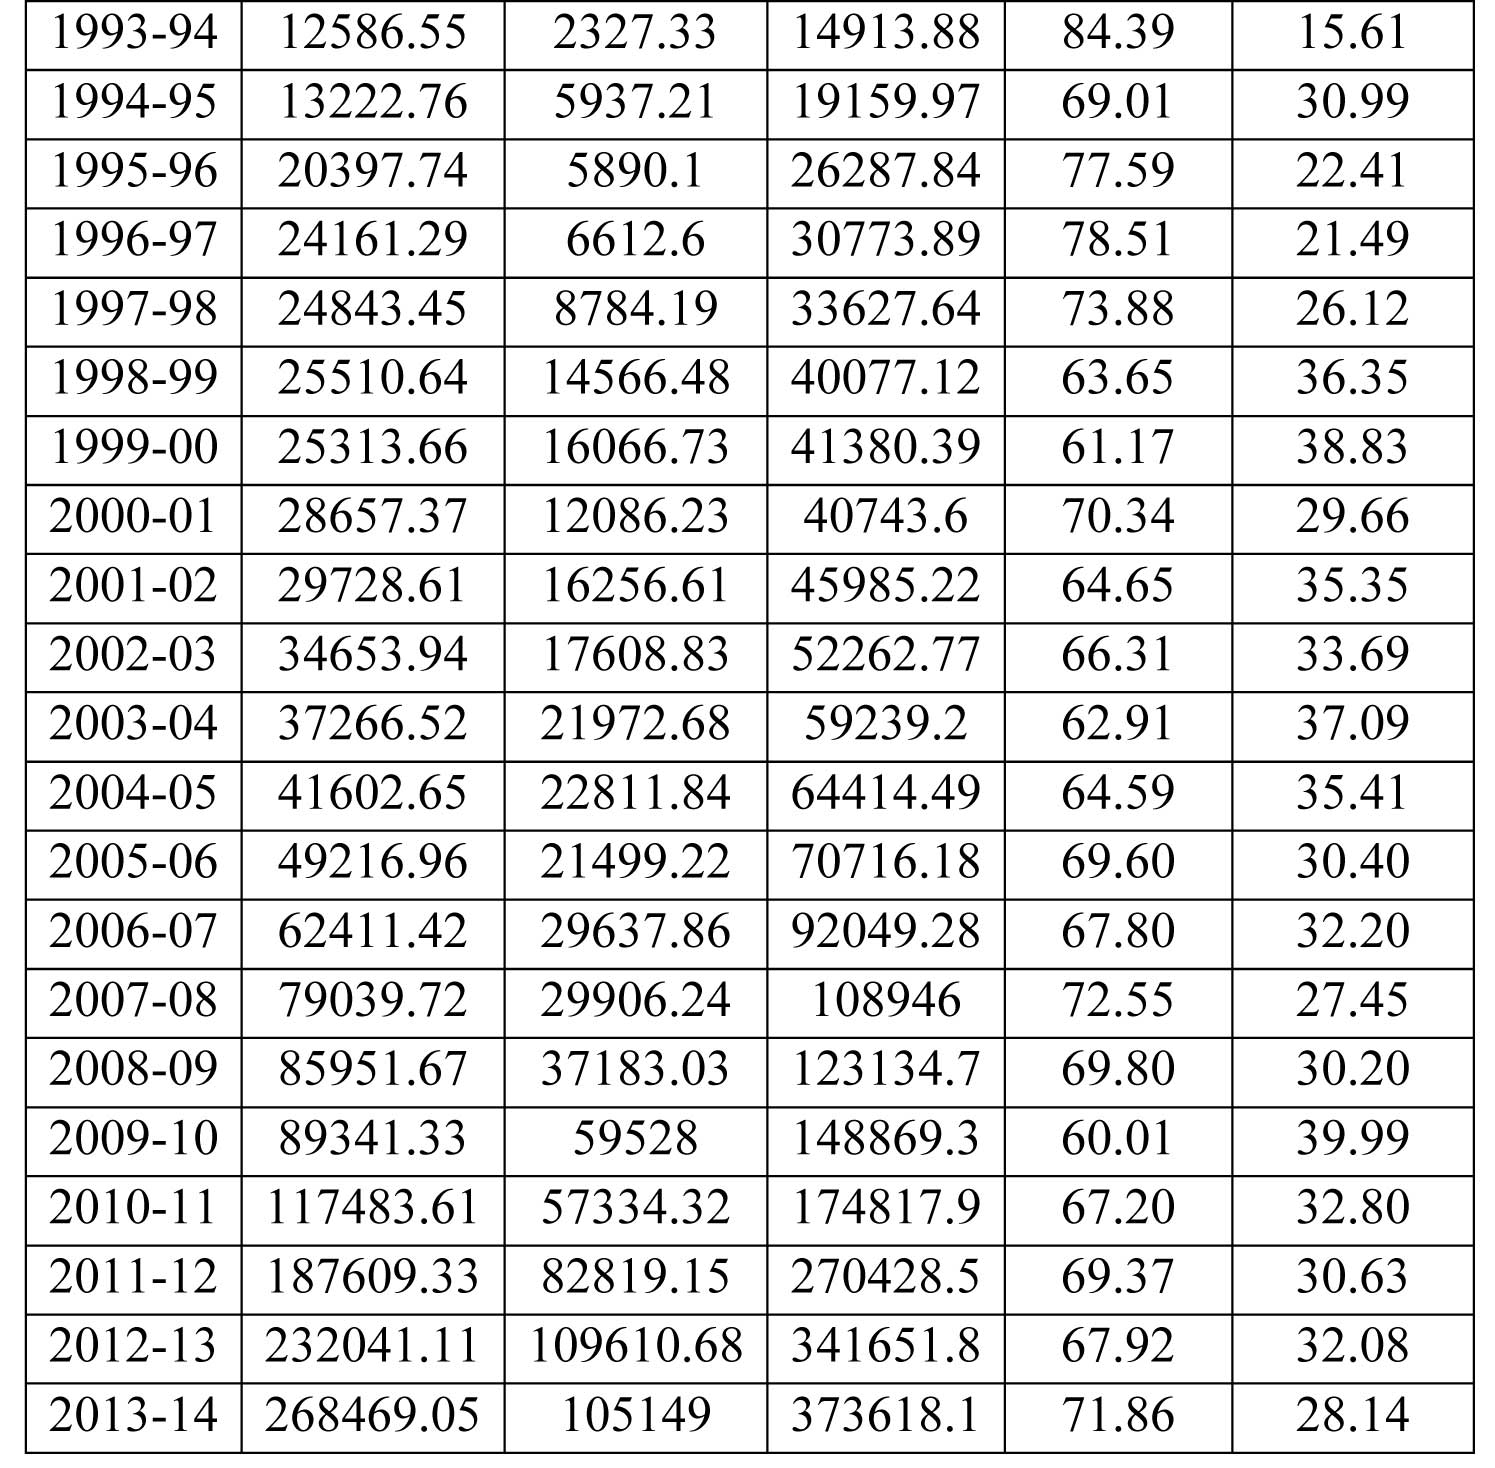
The composition of agricultural trade is analysed with the help of estimating Agricultural Export (here after AE) and Agricultural Import (here after AM) with respect to Total
Agricultural Trade (here after TAT) over the pre and post Reform period. In this figure-3 and appendix: table-3, the share of AE and AM in TAT are demonstrated. By taking time
periods of 34 years spanning from 1980-81 to 2012-13 (including pre and post Reform period), the ratio of AM to TAT and AE to TAT is calculated. The figure-3, at a first look
suggests that the share of AE in TAT was always greater (average of AE/TAT: 67.34%) than the share of AM (average of AM/TAT: 32.66%). In 1990-91 to 1992-93 the share of AE to
TAT increased to 84.39% which was possible due to the introduction of New Economic Policy (NEP) on Indian economy which focused on the
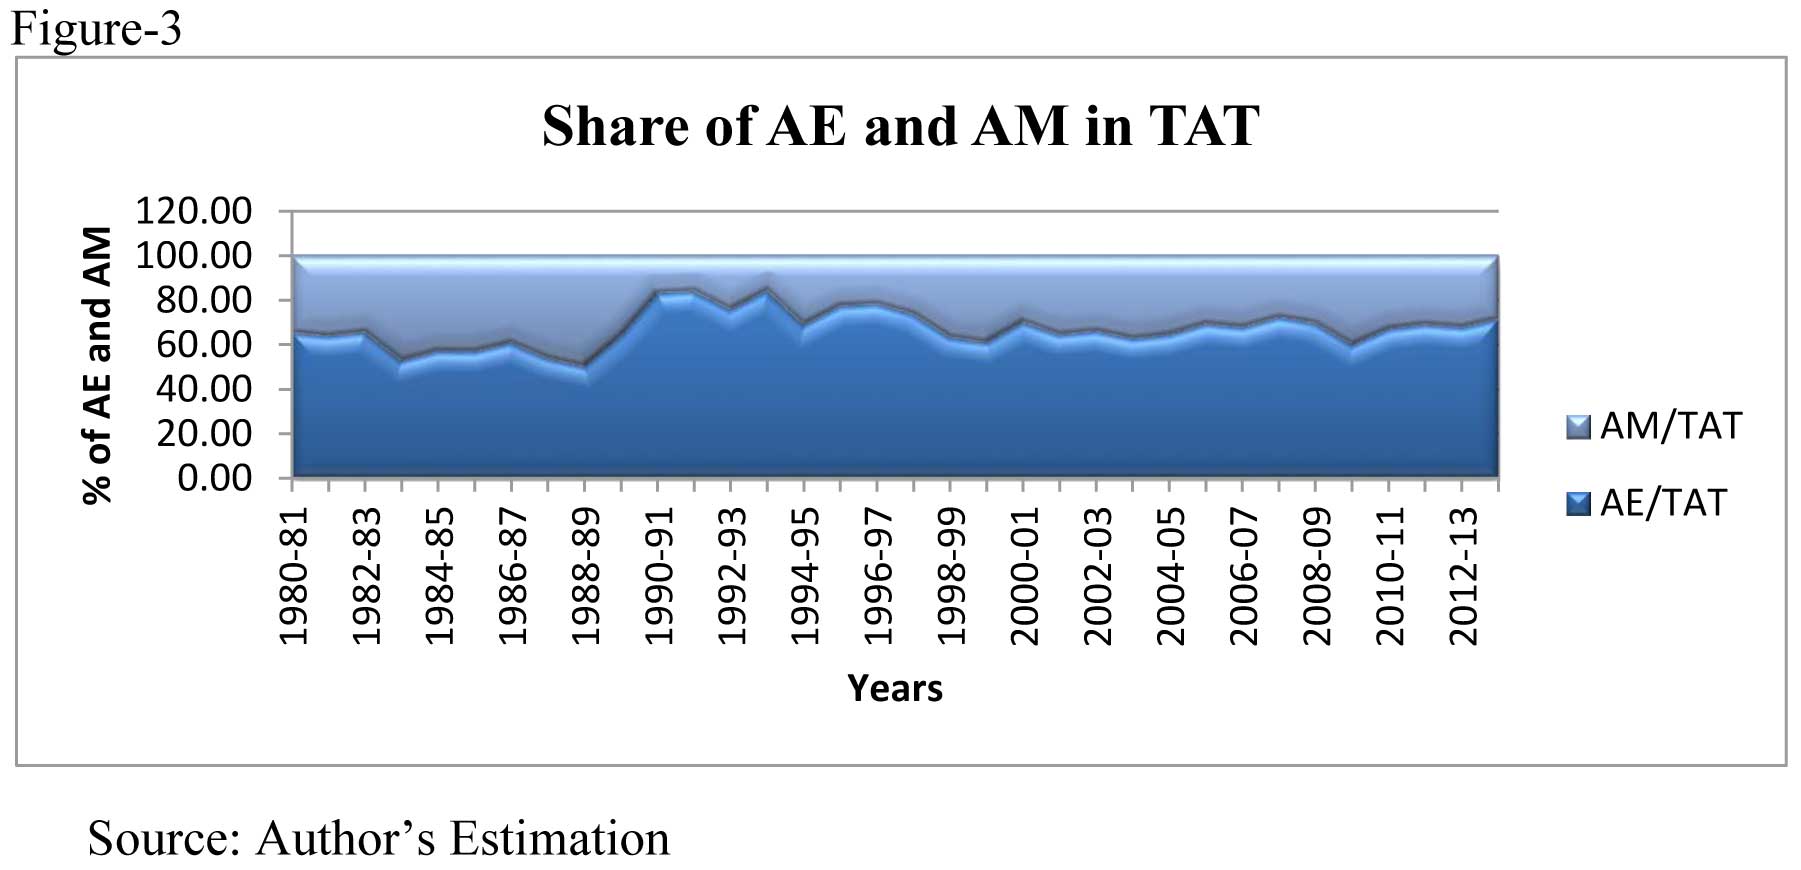
development of agricultural sector by path of Liberalisation, Privatisation and Globalisation (LPG).9 Also the global trading-environment gives opportunity to Indian economy for
a favourable Terms of Trade (TOT) for agricultural commodities.10 The figure also indicates a rise in the share of import of agricultural products in the year of 1988-89
(AM/TAT: 49.60%) in the pre Reform period. Tyagi (1987)11 has analysed TOT on agricultural sector and finds that it has an adverse effect on the agricultural export during that
period. Thus the whole figure gives a favourable picture of Indian agricultural trade during the post reform period.
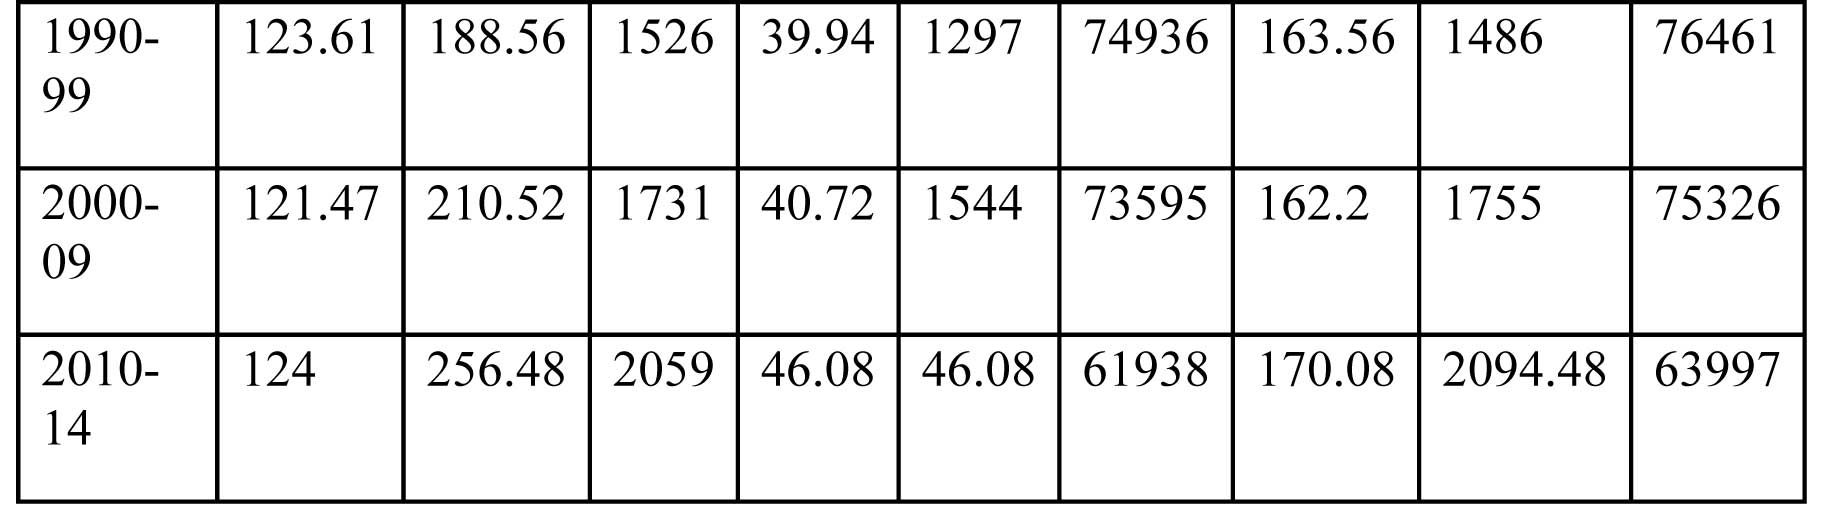
Here a comparative study of different types of tradable agricultural crops is taken, as illustrated in the table-3.
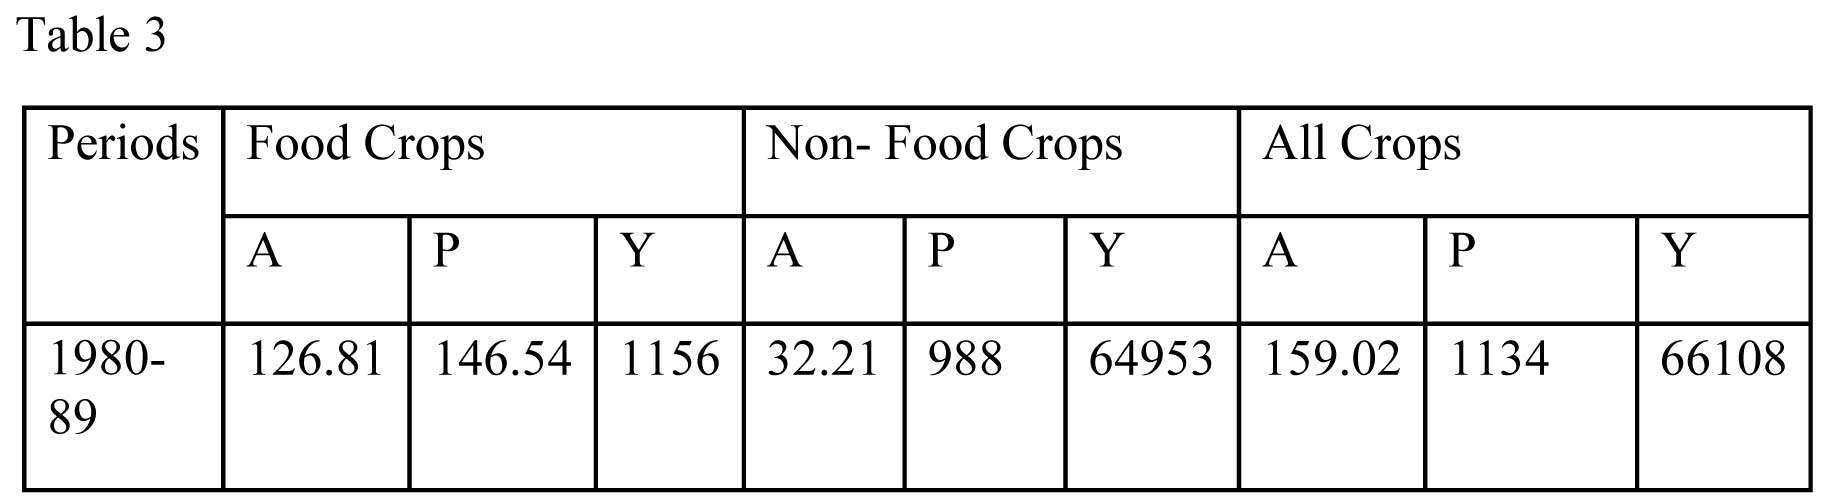
Sources: Computed data from Indiastat and Economic and Political Weekly Research Foundation Note: Here the star (*) value signifies presence of high volatility within the
concerned periods.
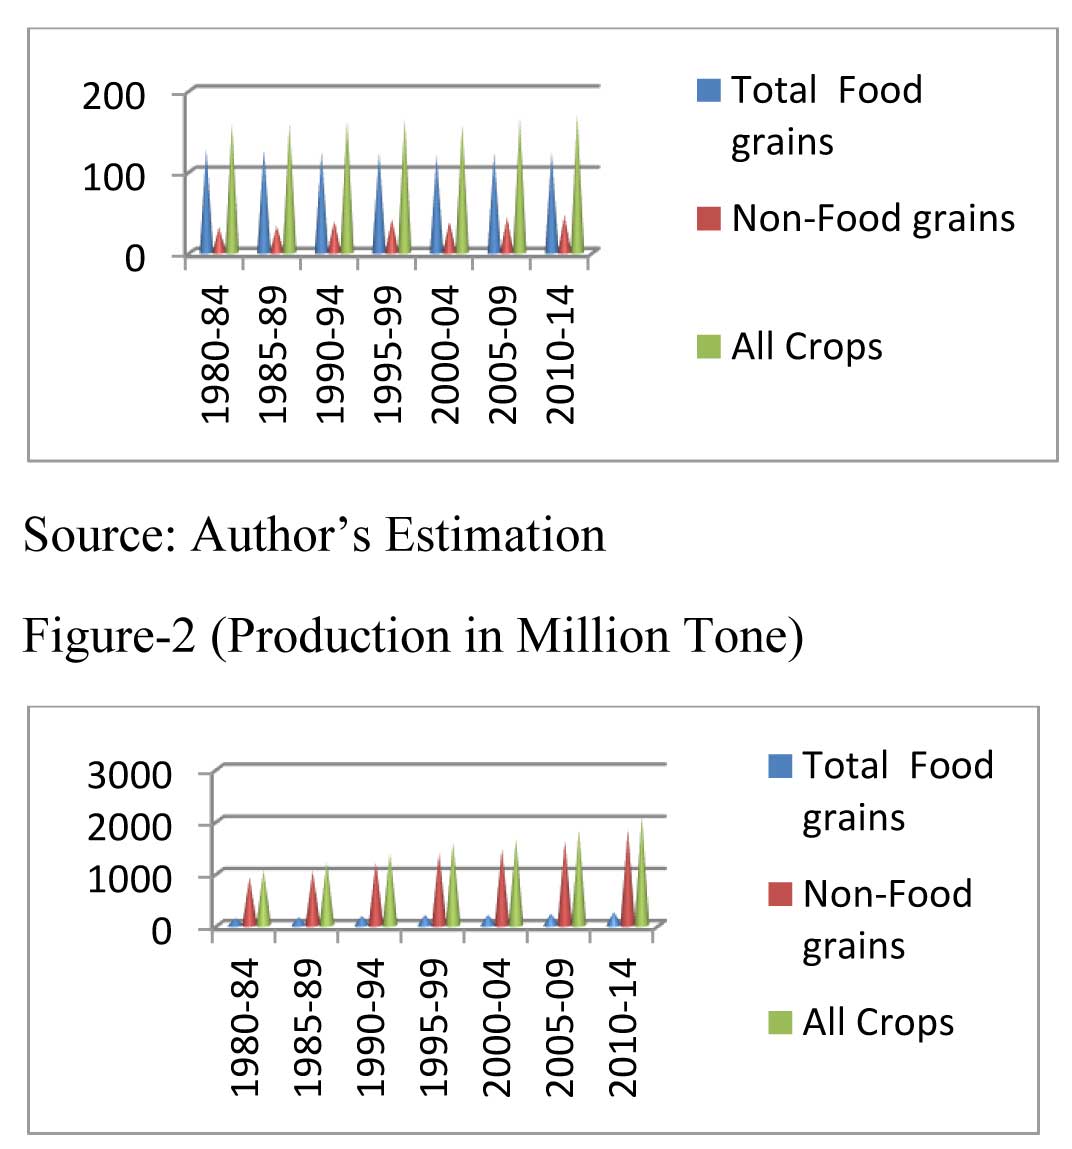
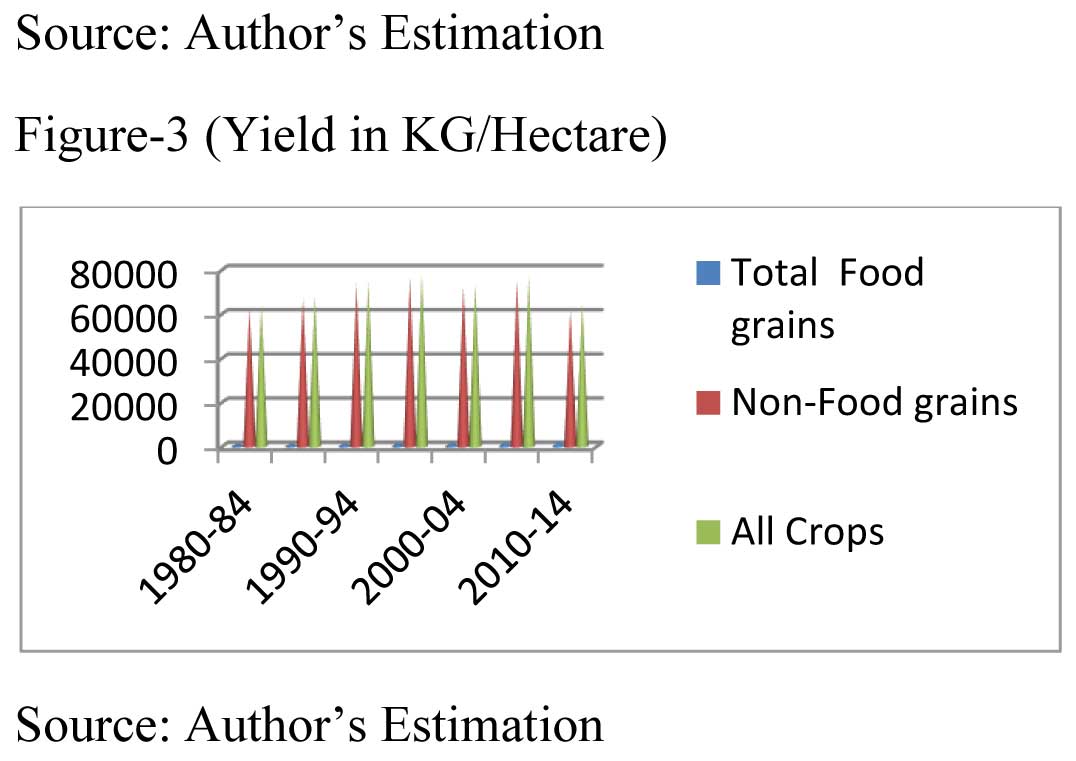
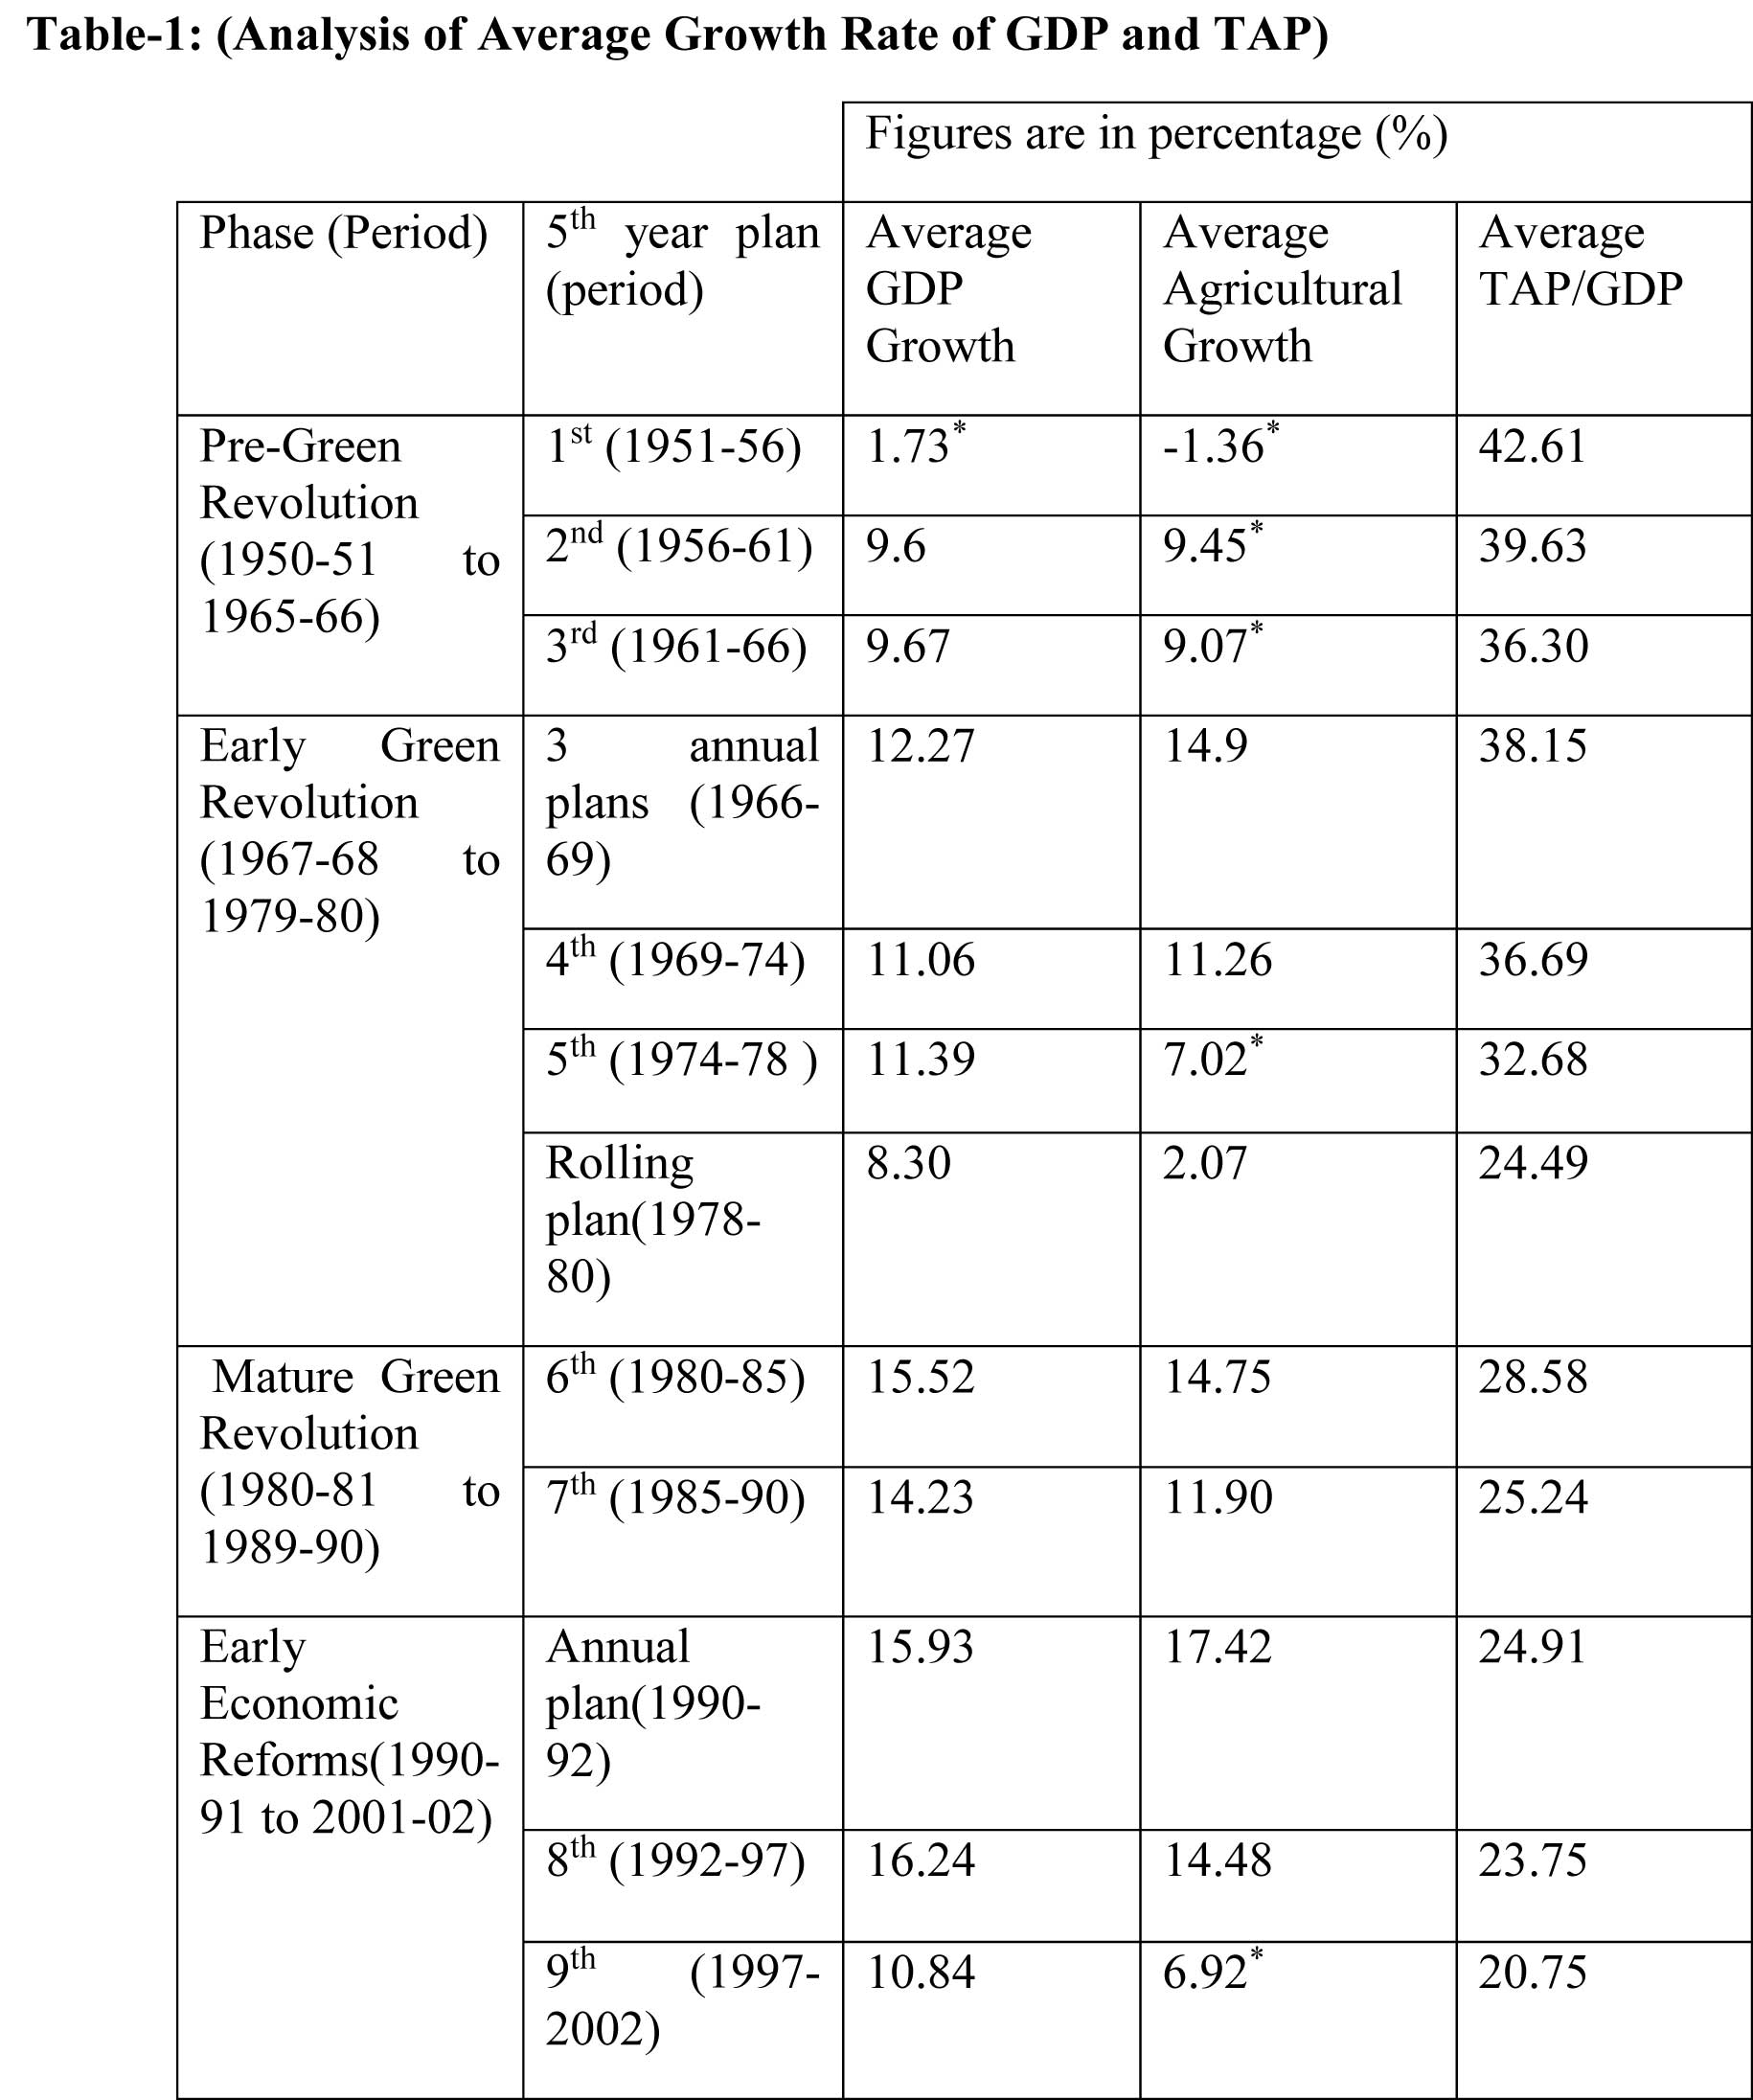
In this table-3, appendix: figure-1, figure-2 and figure-3, the variable like periods of Reform i.e. pre Reform (1980-89), Reform (1990-99) and post Reform periods
(2000-09 to 2010-14) are compared with some selected crop items which includes the major food crops as well as cash crops, in agricultural trade in India. Some other important
variables like A=Area (Million Hectare), P= Production (Million Tone), Y=Yield (KG/Hectare) etc. which gives information about the production areas, production and yield of these
crops. The table demonstrates that the pattern of crops yield has moved in a singular path till the end. But of course the 1991 trade liberalisation has put its significant effects
on the composition by changing the pattern, which at first comprises mostly of food grain crops, but later on shifted to the trade in commercial (non-food grains) crops varieties.
Instead of facing increasing competitiveness of production of food grains like rice, wheat, cereals, the farmer opted for cash crops and oil seeds, which deliberately changed the
pattern of trade.
5.1 Summary and Implication of the Results:
The result of dummy variable regression model and its estimation with ordinary least square suggests that, although the ratio of agricultural trade to agricultural production is
increased, the share of agricultural trade to total trade has been decreasing after trade liberalisation. The causes of slashing down of the TAT to TT ratio traced to impediment
of duality (higher subsidy to the industrial sector), strong and worldly competitiveness of agricultural marketing, non-symmetrical treatment to agricultural sector and world
food & fuel crisis in 2008. The empirical finding also reveals that though there is a statistically significant increment in TAT to GDP ratio after the reform of 1991, this
increment is not promising. The analysis of the second objective shows that the share of agricultural export was always greater (average of AE/TAT: 67.34%) than the share of
agricultural import (average of AM/TAT: 32.66%). It has been inferred from the annual growth analysis that, the annual average growth of agricultural trade (TAT) has been
substantially higher than the agricultural products (TAP) and GDP in their corresponding value, despite been lower than the annual average growth rate of total trade (TT).
The finding of the study that the percentage share of agricultural products in GDP and in TAP has been increasing, is also is in confinement with the findings of the literatures
of Reddy (2009), Sharif (2009), Joshi (2010) and Ghatak (2010). Hence, it can be inferred that although agricultural trade was not very encouraging during pre-reform period,
the percentage share of agricultural products in total national trade was very high. Only it has started to fall during the reform period due to more policy emphasis was given
to industrialisation and service sector growth. But, the commencement of WTO policy measures for the agricultural sector in worldwide developing countries like India,
agricultural productivity per area, as well as its yield, has been improvised significantly. The data analysis demonstrates an upward trend about the contribution of agricultural
products in GDP after 2000-01 or we can say in the post-reform period. Hence it can be said that in the process of economic development, the period of reform following the path
of trade liberalisation, have put a very significant impact on the agricultural sector in India, by raising agricultural productivity as well as increasing its share in
international trade.
As the trade policies of the government have always discriminated against agriculture, Maralusiddaiah and Ramesha (2015) suggested that India has to be carefully guiding its
course in order to reap the benefits out of trade liberalisation in the agricultural sector. In the face of accelerated GDP growth after reform, the degrading agricultural
contribution in trading sector needs an in-depth analysis by the researchers. Moreover, when reforms directly affecting agriculture will be initiated in an economy, only then
agriculture can derive the full benefits from those macroeconomic reforms introduced so far after 1991. In addition, India can reap significant gains from trade liberalisation,
if it frees up imports and exports of agricultural products at zero duty. Also, India needs formulation of a consistent policy framework on the basis of comparative advantage
for export of agricultural products and emphasising on freedom of the exporters to enter into long-term contractual agreements with international farms. Somehow the terms of
trade have shown a favourable tendency in influencing private investment in Indian agriculture. Thus, more favourable terms of trade to agriculture would raise the aggregate
production/marketed surplus. By reducing the protection of industries, the terms of trade becomes favourable for agriculture. The study reveals that impact of liberalisation
differs from crops to crops and there is a scope for increasing its benefits by formulating commodity-specific policies on pricing, production, tariffs, and trade. Overall there
is a need for a proper policy framework to close the gap between the potential and actual performance of agricultural trade in the global market.
APPENDIX: Figure-1 (Area in Million Hectares)
 Sources:
Computed data from Planning Commission of India (GoI), Hand book of Statistics (RBI) and Indiastat. Note: The star (*) value indicates presence of at least one negative value
Table-2: (Share of AE and AM in TAT)
Sources:
Computed data from Planning Commission of India (GoI), Hand book of Statistics (RBI) and Indiastat. Note: The star (*) value indicates presence of at least one negative value
Table-2: (Share of AE and AM in TAT)
Source :
Ministry of Agriculture, Govt. of India.
References :
- Ahmad, T.M.A.T., and A. Tawang, (1999), “Effects of Trade Liberalisation on Agriculture in Malaysia: commodity aspects”, Regional Co-ordination Centre for Research and Development of Coarse Grains, Pulses, Roots and Tuber Crops in the Humid Tropics of Asia and the Pacific, Working Paper Series No. 46
- Bhalla, G.S., and G. Singh, (2009), “Economic Liberalisation and Indian Agriculture: A state wise analysis”, Economic and Political Weekly, Review of Agriculture, p.p. 34-44.
- Brandao, A.S.P., and W. Martin, (1993), “Implications of Agricultural Trade Liberalisation for the Developing Countries”, Agriculture and Rural Development Department and the International Trade Department of the World Bank, Working Paper Series No. 1116
- Chand, R., (1999), “Liberalisation of Agricultural Trade and Net Social Welfare: A Study of selected crops”, Economic and Political Weekly, Vol. 34, No. 52, p.p. A153-A159
- Deshpande, R.S., and M. Indira, (2004), “Globalisation and Indian Agriculture: Performance under a new paradigm”, p.p. 28-47
- Dhingra, I.C., (2011), “The Indian Economics: Environment and Policy”, Sultan Chand and Sons, 26th Edition, p.p. 263-758
- Economic Survey (different publications)
- Economics and Political Weekly Research Foundation, Data Base
- Gulati, A., and A. Sharma, (1997), “Freeing Trade in Agriculture: Implications for Resource Use Efficiency (RUE) and Cropping Pattern Changes”, Economic and Political Weekly, p.p. A155-A163
- Krishnaswami, K.S., (1994), “Agricultural Development under the New Economic Regime”, Economic and Political Weekly, Vol. 29, No. 26, pp. A65-A71
- Kumar, T.K., and A. Mittal, (1995), “On Liberalising Agricultural Trade: A Note of Caution from India's Experience with Tea Trade”, Economic and Political Weekly, p.p. 3069-3071
- kuznet S., Six lectures on Economic Growth, p.p. 59
- Maralusiddaiah, H.M., and K.G. Ramesha, (2015), “Impact of globalisation on Indian Agriculture”, International Journal of Social and Economic Research, Vol. 5, Issue. 1, p.p. 119-146
- Ministry of Agriculture and Farmers Welfare, Data Base, (GoI)
- Minocha, A.C., (1995), “Globalisation and Indian Agriculture”, Economic and Political Weekly, Special Articles, p.p. 833
- Misra, V.N., (1998), “Economic Reforms, Terms of Trade, Aggregate Supply and Private Investment in Agriculture: Indian Experience”, Economic and Political Weekly, Special Articles, p.p. 2105-2109
- Nayyar, D., and A. Sen, (1994), “International Trade and the Agricultural Sector in India”, Economic and Political Weekly, Special Articles, p.p. 1187-1201
- Parikh, K.S., Narayana, N.S.S., Panda, M. and A.G. Kumar, (1995), “Strategies for Agricultural Liberalisation: Consequences for Growth, welfare and Distribution”, Economic and Political Weekly, p.p. A90-A93
- Planning commission of India, Data Base, (GoI) (2013-14)
- Rakshit, G., (1998), “India’s Economic Reforms: New Economic Policy”, The World Press pvt.ltd, 1st Edition, pp. 1-39
- Rao, C.H.H., and A. Gulati, (1994), “Indian Agriculture: emerging perspective and policy issues”, Economic and Political Weekly, p.p. A158-A169
- Reddy, A.R., and M.S.K. Raju, (2008), “Impact of Globalisation on Indian Agriculture”, Inclusive Growth in Globalised India, Chapter. 7, p.p. 81-92
- Rostow, W.W., “the Stages of Economic Growth”, p.p. 25
- Soni, R.N., (2010), “Leading Issues in Agricultural Economics”, Vishal Publishing Co., India, 6th Edition, p.p. 125-518
- Srinivas, K.R., (1996), “Sustainable Agriculture, Biotechnology and Emerging Global Trade Regime”, Economic and Political Weekly, p.p. 1922-1923
- Tyagi, D.S., (1987), “Domestic Terms of Trade and Their Effect on Supply and Demand of Agricultural Sector”, Economic and Political Weekly, Review of Agriculture, Vol. 22, No 13, p.p. A30-A36
- Vaidyanathan, A., (2000), “India’s Agricultural Development Policy”, Economic and Political Weekly, Vol. 35, No. 20, p.p. 1735-1741
- Vyas, V.S., (1996), “Agricultural Trade Policy in Asian Developing Countries”, Agricultural Trade Policy in Asia- Pacific- A Study Meeting Report, p.p. 117-135
- World Development Indicators, Data Base, (World Bank)
- World Trade Organisation, Data Base