Subscribe now to get notified about IU Jharkhand journal updates!
Does Workforce Diversity Influence Employee Performance? An Empirical Analysis of Nepali Civil Service
Abstract :
In the last few years, workforce diversity and employee performance have gained intensive attention among policymakers, scholars and management experts all over the world including Nepal. Nepali civil service has become socially and demographically diverse than ever before after the introduction of inclusion policy in 2007 through the second amendment of the Civil Service Act, 1993. In this regard, this paper aimed to examine the influences of workforce diversity on employee performance. In total 120 civil service employees were interviewed through structured self-administrative questionnaire and data were analyzed by applying descriptive and inferential statistics. The finding showed that civil service employees are more positively perceived as the organization's practices of respecting gender and caste/ethnicity diversity than age diversity. Civil service employee perceived themselves as a performer. However, the level of perceived diversity and performance is varied by their personal/demographic attributes. This study also showed that perceived diversity and performance are significantly positively associated. It is remarkable to note that respecting gender and caste/ethnicity diversity has more influence on performance. Civil service employees who positively perceived organization practices of respecting diversity is more likely to be performer than who do not. Hence, this study concludes that workforce diversity has a positive influence on employee performance.
Keywords :
Workforce diversity, performance, gender, age and caste/ethnicity.Introduction:-
In the last decade, the growing diverse workforce in Nepali civil service has led policymakers, planner, practitioner and academia pays more attention to the issue of diversity. This attention is the impact of the inclusion policy. Workforce diversity in Nepali civil service is nationally apparent as a remarkable issue after the institutionalized inclusive policy in 2007 as recommended by the Interim Constitution of Nepal 2007 through the second amendment of civil service act 1993. This act specifically addresses past injustices and discrimination of marginalized and disadvantaged group representation in the civil service rather than the need for diversity in civil service. This civil service act 1993 (second amendment) allocated 45% seats for the reservation of the different groups namely women (33%), Adiwasi/Janajati (27%), Madhesi (22%), Dalit (9%), disabled (5%) and backward area (4%). As a result, Nepali civil service organizations became socially, culturally and demographically diverse. It is said that workforce diversity should be recognized and valued in the civil service. If it is not, it leads to conflict and low employee engagement which ultimately create an obstruction for effective and efficient performance. Knowing, understanding, recognizing and valuing of each civil service employee of their distinctive characters can positively contribute to the performance. As per Saxena (2014), workforce diversity in the organization may positively or negatively influence the performance of employees. If it is managed and treated suitably, it may outcome in improved decision making, higher creativity and improved productivity (Maingi, 2015). Conversely, if it is not, it may result in lowly communication, low employee morale, increased conflicts, consequently leading to poor employee performance (Munjuri, 2012). Hence, proper management and value the diversity are required for effective and efficient employee performance in Nepali civil service. Workforce diversity in Nepali civil service is an opportunity for making more effective and efficient delivery system. Hence, understanding the effect of workforce diversity on employee performance is key for organizational development and sustainability. In this regard, this study aimed to examine the influences of workforce diversity on the performance of civil service employee.
Workforce Diversity
Workforce diversity is an asset to the organization. It has been frequently used by organization leader, employee, policymakers, practitioners, bureaucrats, and academicians. However, the workforce is defined and perceived in various ways in the literature. It has been described as a narrow or broad. Scholars like Ehimare and Ogaga-Oghene (2011), Veldsman (2013) and Lee and Gilbert (2014) have defined workforce diversity from a very narrow perspective whereas scholars such as Carelse (2013), Foma (2014), Barak (2016) from a broader perspective. From the narrow viewpoint, it is defined as the degree of heterogeneity among employees that is precisely limited to specific cultural attributes such as age, gender and ethnicity (Ehimare & Ogaga- Oghene, 2011; Veldsman, 2013; Lee & Gilbert, 2014). In other word, it refers to organizations that are becoming more heterogeneous with the mix of people in terms of gender, age, race, and education background (Robbins, 2009). On the other hand, broader perspective defined the workforce diversity as an acknowledging, understanding, accepting, valuing and celebrating differences amongst people with respect to a whole continuum of differences including age, class, ethnicity, gender, physical and mental ability, race, economic status, sexual orientation, spiritual practice and public assistance status (Carelse, 2013; Foma, 2014; Barak, 2016). This study adopted a broader perspective of workforce diversity to examine the perception of the employee in existing practices of respecting the gender, age and caste/ethnicity diversity in the civil service and its influence on employee performance.
Employee Performance
Even though the notion of performance is very common in academic literature, it is perceived and defined variously by different scholars. As per Langran (2002), performance is the record of the outcomes produced on specified job, function or activity during a specified period of time. In other word, performance is defined as working effectively which is the way in which somebody does a job, judged by its effectiveness (Cascio, 2000). O'Toole Jr. and Meier (2011) see performance as the achievements of public programs and organizations in terms of the outputs and outcomes that they produce. Tinofirei (2011) defined the employee performance as the successful completion of tasks, as a set and measured by a supervisor or organization, to pre-defined acceptable standards, while efficiently and effectively utilizing available resources within a changing environment. For Iqbal, Anwar and Haider (2015), employee performance includes executing defined duties, meeting deadlines, employee competency, effectiveness, and efficiency in doing work. Considering the literature reviewed, this study adopted an idea of Iqbal, Anwar and Haider (2015) to measure the perceived employee performance in the Nepali civil service.
Gender Diversity and Employee Performance
Gender diversity at the workplace has received the growing attention of both academics and practitioners and raised the question whether gender diversity in an organizations' affect the individual, group or organizational performance (Gupta, 2013). Workforce diversity remains ineffective if gender issues are not first recognized (Brown, 2008). It is said that a mixed-gender performed better than the same gender groups (Eagly & Wood, 1991). Well-adjusted composition of gender diversity in the organization may create synergy effects which contribute to the performance of the employees. This is because male and female employees have different abilities and competencies which boost solidity, unity, ingenuity, and innovation for effective and efficient individual or organization performance. As per Frink et al. (2003) and McMillan-Capehart (2006), gender diversity has a positive effect on the performance of the organization. Scholars such as Eugene et al. (2011), Kyalo (2015), Ngao and Mwangi (2013), Selvaraj (2015) and Mwatumwa (2016) indicated that gender diversity is positively associated with the employee and organizational performance. Definitely, individual or organizational performance is increased if gender diversity is capitalized and maximized. For this, both male and female employee has to get equal opportunities in all aspect of the organization and discrimination and prejudice should be minimized and eliminated from the organization culture and environment. Considering these all thing, this study examined employee perception on existing practices of respecting gender diversity in the civil service and its influence on employee performance.
Age Diversity and Employee Performance
Age diversity has become an unavoidable fact of life in many organizations (Kunze et al., 2011). It is defined as the differences in age distribution among employees within the organization (Kunze, 2013). Age-diverse workforce's presents a multitude of diverse knowledge, values, perspectives, interpretations and preferences which are prerequisites for innovation (Richard & Shelor, 2002). A mixture of young and old cohorts of employees with different knowledge and ideas can surge innovation as compared to having homogeneous employees (Gelner & Veen, 2013). As per Boehm and Kunze (2015), age heterogeneous workforce yields a host of multiple skills, intellectual styles, morals, and preferences that may result in increased productivity. The perceptions, cognitive models and interpretations of an age-diverse workforce are different which result in a larger pool of knowledge, a larger problem-solving toolbox and increased employee performance (Park & Lin, 2008 cited in Odhiambo, Gachoka, & Rambo, 2018). A heterogeneous age group of employees would accordingly be more creative, dynamic and productive than a homogeneous age group (Williams & O'Reilly, 1998; Zenger & Lawrence, 1989 cited in Amla, 2017). Conversely, Barton (2004) indicates that groups with more diverse in age had been greatly less productive. Similarly, Gelner and Stephen (2009) argued that age heterogeneity can negatively affect employee productivity due to differences in values and preferences of distinct age groups (as cited in Odhiambo, Gachoka, & Rambo, 2018). Age heterogeneity can adversely influence profitability and productivity distresses, dissimilarities in the values in and inclinations of diverse age sets (Backes- Gellner & Veen, 2009). However, Elsaid (2012) showed that there is no relationship between age diversity and employee performance. In the same line, Kyalo (2015) and Selveraj (2015) revealed that age diversity is not related to employee performance. Considering this all scholars views and finding in the mind, this study examined employee perception on existing practices of respectingthe age diversity in the civil service and its influence on employee performance.
Ethnicity Diversity and Employee Performance
There is growing attention in academia and the public sector about ethnic diversity and employee performance. As per Dastane and Eshegbe (2015), ethnicity diversity workforce may be advantageous and disadvantageous to organizations. If ethnicity diversity is valued and managed properly, it may be advantageous and vice versa. Scholars such as Kyalo (2015) and Odhiambo (2014) observed that ethnic diversity is positively and significantly related to employee performance. This is because ethnicity diverse workforce may contribute to being more creativity and innovation for the organization which in turn increase organizational performance (Van Knippenberg, Van Ginkel & Homan, 2013). It brings different views for problem-solving, new creative ideas which lead to improved team performance (Martin & Nakayama, 2015). Ethnically diverse teams result in extra creativity and innovation because of complementarities and learning opportunities (Alesina & La Ferrara, 2005; Lee & Nathan, 2011; Ozgen et al, 2011). Despite this, Jackson et al. (2003) argued ethnicity diversity showed poor performance than homogeneous groups. If ethnicity diversity is not valued, it may raise conflict and clash in the organization due to social classification and grouping. Ethnic based and clashes may negatively affect the reputation, performance and profits of the organization (Bleaney & Dimico, 2016). Hence, organizations should adopt proper ethnic diversity management strategies timely for minimizing intergroup conflict and clash for effective and efficient individual and organization performance. Nepali civil service organization has become ethnically diverse after the adaptation of inclusion policy by Government of Nepal in 2007. Therefore, this study examined employee perception on existing practices of respecting the caste/ethnicity diversity in the civil service and its influence on employee performance.
Research Methods
This study was employed a quantitative approach
where the survey was adopted as a strategy of
inquiry. Descriptive and explanatory research
designs were used. Descriptive design was used to
find the level of diversity and performance and
explanatory design was used to examine the
influences of workforce force diversity on employee
performance of Nepali civil service. This study was
randomly distributed 250 questionnaires to civil
service employee but only 120 civil service
employees were returned. Hence, this study
delimited to 120 civil service employee as a sample.
During the selection of the respondent's gender, age
and caste/ethnicity diversity was carefully
considered. Data were generated from the
structured self-administrative questionnaire (5
points Likert scale). The structured self-administrative questionnaire was designed based on
the issues raised in literature regarding the
respecting gender, age, caste/ethnicity and
performance. The questionnaire was finalized after
several levels of discussions with peers and subject
experts. After this, the questionnaire was pretested
and reliability was checked with the help of
Cronbach's á. The acceptable reliability score (0.7
and higher) was found for all construct of diversities
and performance. Based on the feedback of pretest,
the questionnaire was finalized and was used for
field operation. The data cleaning process was done as soon as data
received from the field. In this process, data were
manually checked to ensure consistency and
accuracy. After this, data were entered in Statistical
Package on Social Science software to generate
descriptive and inferential information. Before
proceeding, normality of data was checked by using
a Kolmogorov-Smirnov test, and Shapiro-Wilk
test.As per these tests, for normality, P-value should
be greater than 0.05 (Garson, 2012). However, in this
test, P-value of all the variables was less than 0.05.
Hence, this study was concluded that data are not
normally distributed. Therefore, this study decided
to use a nonparametric test to check association and
causes and effect relationship between variables.
Median was used to check the level of respecting the
gender, age, caste ethnicity diversity and
performance. To check the association, Spearman's
rho correlation was used because it doesn't demand
normality and used in ordinal data. For the causes
and effect relationship, binary Logistic regression
was used. It was used to analyze the relationship
between a predictor (respecting diversities) and an
outcome (performance) that is dichotomous in
nature (Reeda &Wu, 2013). As per Park (2013), binary
logistic regression is typically used when the
dependent variable is dichotomous and the
independent variables are either continuous or
categorical or both. For this, this study was
categorized dependent variable in two different
forms–being a performer (coded as '1') and not being
a performer (coded as '0'). Respecting diversity
(gender, age and caste/ethnicity) was taken as
independent variables. Probability of being or not
being a performer is compared against each
reference category of respecting diversity. The
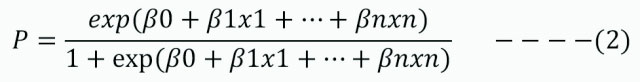
Logistic Regression Equation:
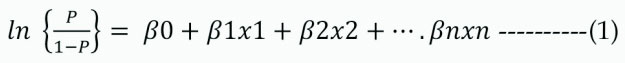
Where, P is the probability that an event occurs; (1-P)
is the probability that an event does not occur; p /(1-
p) represents the “odds” of the event occurring and
so ln[p /(1- p)] is the log-odds of the event, âx = the
coefficient of the predictor variables. Probability of
the outcome (eg. being a performer) occurring can be
expressed in terms following way:
The slope represents the ratio of the probability of
being a performer to the probability of not being
performer compared against each reference
category of respecting diversity (gender, age and
caste/ethnicity). After these all test, required data
was tabulated, described and generate meaning
from them.
Level of Diversities and Performance
The analysis of this study is completely based on the individual perception of civil service employee regarding the existing practices of respecting gender, age and caste/ethnicity in the organizations. This section shows that the level of diversities (gender diversity, age diversity and caste/ethnicity diversity), and performance by demographic characteristics. The level of diversity and performance by demographic characteristics of civil service employee are as follows:
Level of Respecting Diversities and Performance by Gender
Figure shows the median value of gender and
caste/ethnicity is more than 4, which indicates that
civil service employees are positively perceived the
organization practice of respecting gender and
caste/ethnicity diversity. However, in case of age
diversity they are less positive. By gender, male
employees perceived more positive on gender, age
and caste/ethnicity diversity than female
employees. It is also found that both male and
female civil service employees are more positive in
caste/ethnicity diversity. In term of performance,
civil service employee reported themselves as a
performer. However, by gender, male civil service
employees reported themselves as a slightly higher
performer than female employees although female
workers are relatively more productive, as per Kotur
and Anbazhagan (2014). This indicates that the
performance of employees is differing by gender.
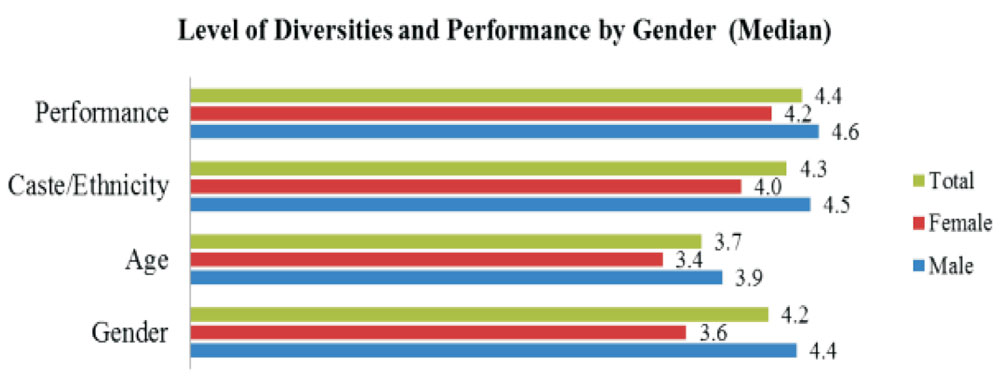
Figure 1 : Level of Respecting Diversities and
Performance by Gender in Civil Service
Level of Respecting Diversities and Performance by Age
Figure 2 shows that the perceived level of respecting
diversities and performance by age in civil service. It
is found that civil service employees of less than 30
years are less positive perceived the organization
practice of respecting gender and age diversity than
older age group. Employees of 31-40 and 51-58 are
more positive. In term of the performance, Kotur and
Anbazhagan (2014) argue that employees in the
medium range of age perform better compared to
those on the extremes but this study showed that
increasing age, performance level also increases.
However, employees of 41-50 years have a slightly
perceived themselves as a low level of a performer
than age of 31-40 years. As per Gupta (2018), late age
carrier (41-50 and 51-58 year) employee perceived
themselves as a more performer than early age
carrier employee. Hence, this study points out that
the perceived performance of civil service is differing
by age.
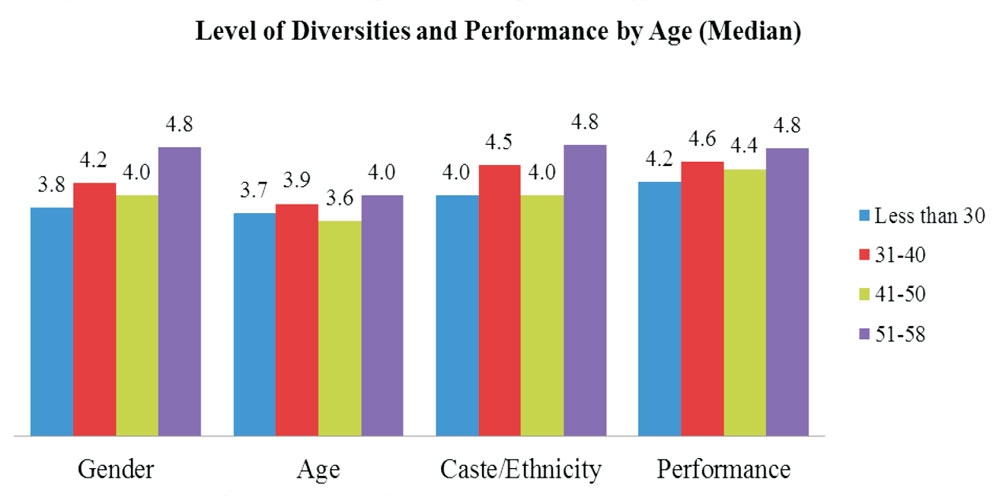
Figure 2 : Level of Respecting Diversities and
Performance by Age in Civil Service
Level of Respecting Diversities and Performance by Education Level
Figure 3 shows that the perceived level of respecting
diversities and performance by education level in
civil service. This study showed that civil service
employees with Intermediate levels are very
positively perceived the organization practice to
respect diversity. In comparison to employees of
Intermediate and bachelor, employees with master
degree perceived less positive. Regarding
performance, Elsaid (2012) argued that the more
education the individual received, the more
productive the worker will be. However, this study
showed a surprising result. Employees with a lower
level of education have a high level of performance.
It is interesting to note that a similar kind of result
was found by Gupta (2018). He found that a higher
level of performance for intermediate than Bachelor
and Master Degrees. From this evidence, it is hard to
say that having higher education does necessarily to
more contribute to employee performance in Nepali
civil service.
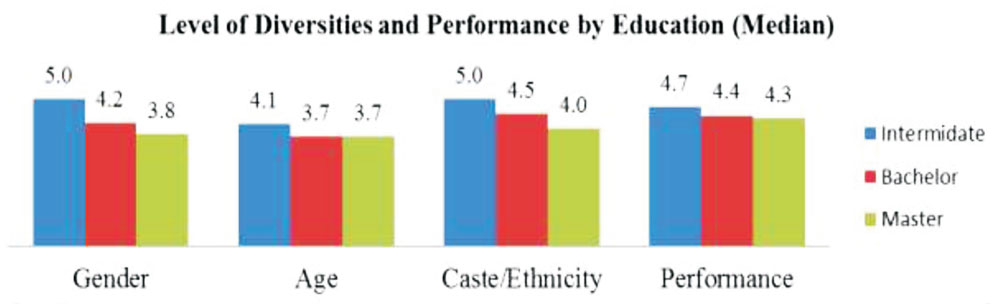
Figure 3 : Level of Respecting Diversities and
Performance by Education Level in Civil Service
Level of Respecting Diversities and Performance by Position
Figure 4 depicts the perceived level of respecting
diversities and performance by position. It is
exciting to note that the level of diversity by position
is found very versatile. Joint secretary employees are
less positively perceived regarding organization
practice towards respecting diversity than other
positions. It is also found that among all positions
employee, undersecretary very positively perceived
organization practice of respecting diversity. At the
officer level, employees are more positive in gender
and caste/ethnicity diversities whereas they are less
positive in age diversity. Non-gazetted first and
second class employee perceived less positive to age
diversity than gender and caste/ethnicity diversity.
Regarding the performance, it is general feeling is
that the higher-level position has a higher level of
performance (Gupta, 2018). This indicates that there
is a positive relation between position and employee
performance. However, this study showed that
there is a negative relationship between position and
performance. A higher mean value of perceived
performance is observed for Non-gazetted second and is found to gradually decrease by increasing
position as found by Gupta (2018). It indicates that
increasing the level of position decrease the
perceived performance of the employees. Hence, this
study points out that having the low-level position of
civil service employee doesn't mean that he/she
perceived themselves as a low performer.
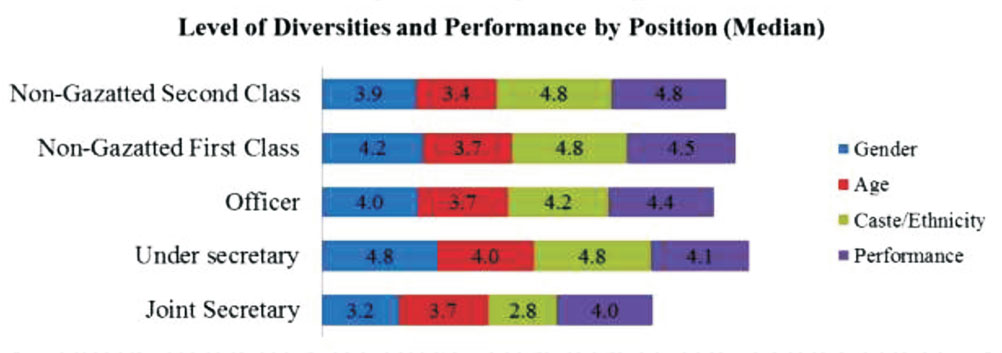
Figure 4 : Level of Respecting Diversities and
Performance by Position in Civil Service
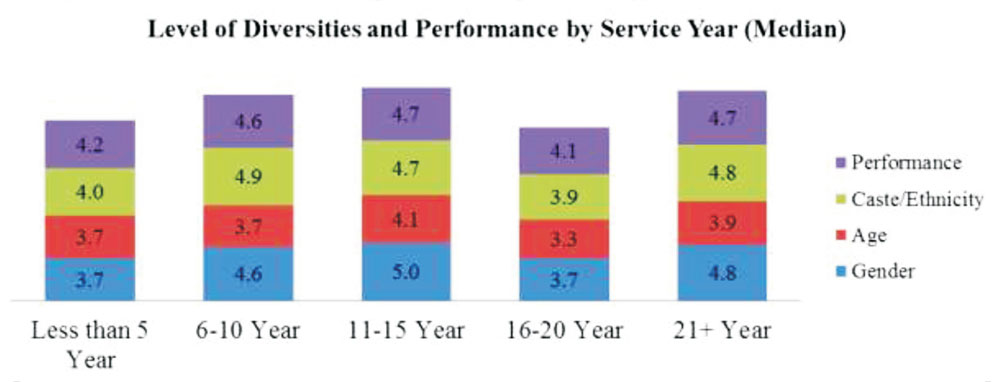
Level of Respecting Diversities and Performance by Service Year
Figure 5 provides the information of the perceived
level of respecting diversities and performance by
service year in civil service. This study showed that
civil service employees of less than 5-year service and
16-20 years of service are less positively perceived
the organization practice of respecting diversities. In
all category of the service year, employees are less
positive to age diversity and more positive to
caste/ethnicity diversity. Regarding performance,
employees with service year of 6-15 and 21 years
above have a high level of performance in
comparison to newcomers and employees of service
year of 16-20. However, Gupta (2018) showed
contradictory result regarding service year and
employee performance in civil service. According to
him employee with extreme service year (5 years and
more than 20 years) perform better than the middle
range of service year. This evidence indicates that the
performance of Nepali civil service employee is
differing by their service year.
Level of Respecting Diversities and Performance by Caste/Ethnicity
Figure 6 illustrates the level of respecting diversities and performance by caste/ethnicity in civil service. Civil service employees of different caste/ethnicity are more positively perceived the organization practice of respectingcaste/ethnicity diversity. However, employees of every caste/ethnicity are less positive to age diversity. Among different caste/ethnicity, it is observed that employees of Madheshi are less positively perceived than others. However, from the performance point of view, there is no significant difference between caste/ethnicity. In comparison to other castes/ethnicity, Janjati/Adhiwashi and Muslim reported a higher level of perceived performance.
Figure 6 : Level of Respecting Diversities and Performance by Caste/Ethnicity in Civil ServiceCorrelation and Regression Analysis
To examine the relationship between respecting
diversity and performance, Spearman's rho
correlation was used. The moderate positive
correlation between respecting diversity and
performance was found. A higher correlation was
observed for respecting gender diversity and the
lowest for respecting age diversity. It is remarkable
to note that correlation is signification because the pvalue
is less than 0.05 (see Table 1). Therefore, this
study concludes that there is a liner positive
(significant) relationship between respecting
diversity and performance has been observed in
Nepali civil service.
Table 1 : Correlation Between Respect Diversity
and Performance
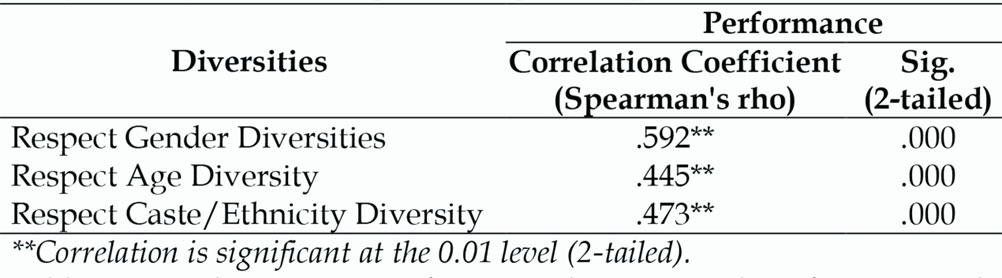
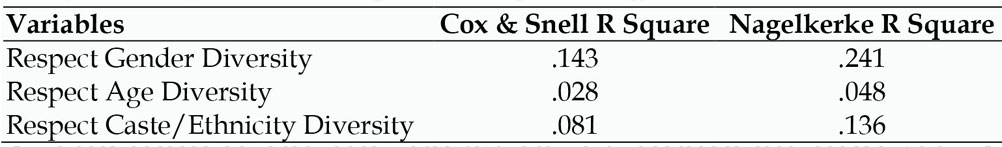
Table 2 provides R Square of respect diversity and
performance. The table reports the strength of the
relationship between respecting diversity and
performance. Nagelkerke R Square value for
respecting gender diversity is .241, which tells that
respecting gender diversity accounts for 24.1% of the
variation in performance. Similarly, Nagelkerke R
Square value for respecting age and caste/ethnicity
diversity is .048 and .136 respectively. This indicates
that respecting age and caste/ethnicity diversity
explains 4.8 % and 13.6 % of the variation in
performance respectively. It is notable to note that
respecting gender and caste/ethnicity diversity
contributes more to performance than respecting age
diversity.
Table 2 : R Square of Respect Diversity and
Performance
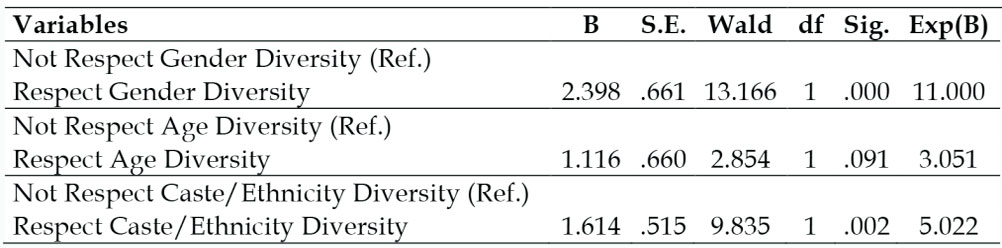
The regression coefficient beta (â), the Wald statistic
and Odds Ratio [Exp (â)] for each reference category
is presented in Table 3. The column called Exp(B)
shows the odds ratio (OR) for the respecting
diversity (gender, age and caste/ethnicity). The
value of OR is 11.000, 3.051 and 5.022 for gender, age
and caste/ethnicity respectively, which means that
there is a positive association between respecting
diversity and performance. In other words, for every
one-unit increase in respecting diversity, the
likelihood of being performance increases. It can be
said that the civil service employee who respect
diversity more likely to the performer than who
don't respect diversity. The p-value for respecting
gender and caste/ethnicity is .000 and .002 which
means that the association is statistically significant.
However, respecting age diversity is not statistically
significant because p value is more than 0.05 (see
Table 4.11).
Table 3 : Coefficients of Logistic Regression for Respecting Diversity and Performance
Discussion and Reflections
The Nepali civil service is demographically diverse than ever before. Different gender, caste/ethnicity and age group employees are working together for ensuring effective and efficient performance in the delivery system. Regarding the relationship between workforce diversity and performance, this study showed a positive relation. Civil service employee who perceived workforce diversities are respectedin an organization is significantly positively associated, and more likely to be performer than who do not. It indicates that respected workforce diversity in the organization contributes to performance. This is because a diverse workforce performs better than homogenous. A diverse workforce is more creative, gives a wide range of perspectives and better solutions with more alternatives (Adler, 2005 cited in Amla, 2017) which creates synergy and interaction effect for employee or organization performance. Definitely, good workforce diversity practices in the civil service positively support and enhance employee or organizational performance. Civil service employees come from diverse background and culture may bring diverse ideas, viewpoints, perspectives, capabilities, skills and commitment for the organization. This may be the reason; Magoshi and Chang (2010) argued that a diverse workforce is an asset for the organization. United capabilities, shared value and interaction with an employee from the diverse cultures, beliefs, and valuesadd the collaborative value for performance if organization culturefavors workforce diversity. Harmonious relation and favorable attitudes regarding diversities are required within the civil service organization for dynamic, efficient and effective performance. The relation between gender, age and caste/ethnicity are as follows:
Gender Diversity and Employee Performance
There is widely discussed in academia about gender and performance relation. This study identified gender and performance is positively related. Employee who perceived that organization respectgender diversity more likely to be performer than who do not. This indicates that respecting gender diversity matter on employee's performance in Nepali civil service. As per Brown (2008), workforce diversity remains ineffective if gender balance is not first recognized. Hence, equal and balanced opportunities in organization for male and female are required for positively subsidize for the efficient and effective organization or individual performance. Gender diversity increases competitive advantage in an organization for performance (Keil, 2007). The government of Nepal has focused gender sensitive organization culture and environment through different laws, policies and guidelines for ensuring gender equality in organization behavior. That might be the reason, this study showed a positive relationship between gender diversity and performance. Employees of a different gender who is working together in Nepali civil service has different abilities, competencies and skills which enhanced individual or organizational performance. Hence, capitalize and maximize gender diversity within the civil service is the first requirement for an effective and efficient organization or individual performance.
Age Diversity and Employee Performance
There is an ongoing debate among scholars about age diversity and employee performance. Scholars such as Richard and Schlors (2002), Page (2007), Backes- Gelner and Veen (2013) and Boehm and Kunze (2015) found age diversity has a positive impact on performance whereas scholars such as Barton and Nickerson(2004) and Backes-Gellner & Veen (2009) found age diversity has a negative effect on performance. Scholars such as Child et al. (2005), Ilmarinen (2005), Elsaid (2012), Kyalo (2015) and Selveraj (2015) found there is no relationship in age diversity and performance. However, this study showed a positive relationship between age diversity and employee performance. It represents the employee who perceived Nepali civil service organizations respect age diversity is more likely to be performer than who do not. The reason behind this, diverse age group employees have diverse knowledge, values, perspectives, skills and experience which boost individual performance. A heterogeneous age group of employees would be more creative, dynamic and gainful than a homogeneous age group (Williams & O'Reilly, 1998).A mixture of young and old cohorts of employees with different knowledge and ideas can surge innovation as compared to having homogeneous employees (Backes-Gelner & Veen, 2013). Therefore, proper management of age diversity is required to get the benefit for age diversity for effective and efficient individual and organization performance.
Caste/Ethnicity Diversity and Employee Performance
Caste/ethnicity diversity in Nepali civil service has gained prime attention after the introduction of inclusion policy in 2007. By caste/ethnicity, Nepali civil service is diverse. Diverse caste/ethnicity employee are working together to achieve organizational goals. It is said that ethnicity diversity wo r k f o r c e ma y b e a d v a n t a g e o u s a n d disadvantageous to organizations (Dastane & Eshegbe, 2015). Scholars such as Jackson et al. (2003) and Bleaney and Dimico (2016) observed that ethnicity diversity organization has poor performance than homogeneous groups. However, in the case of Nepali civil service, this study showed a significant positive relation. This means that civil s e r v i c e emp l o y e e wh o p e r c e i v e d t h e organizationsrespect caste/ethnicitydiversity is more likely to be performer than who do not. It is said that caste/ethnicity diversity brings diverse views for problem-solving, new creative ideas which lead to improved team performance (Martin & Nakayama, 2015). Government of Nepal has focused to remove all kinds of discrimination in the workplace as well as outside by passing different laws, policy and guideline. Absence of discrimination based on caste/ethnicity in civil service organization support for innovation and creativity which in turn strength the individual or organization performance. If caste/ethnicity diversity is not valued, it may raise conflict and clash in the civil service organization due to social classification and grouping. Caste/ethnicity diversity exists in civil service organization but it should be properly treated and managed for ensuring synergy effect for an effective and efficient individual or organization performance.
Conclusion
Nepali civil service workforce is getting more and more heterogeneous due to the effects inclusion policy taken by the Government of Nepal in 2007. After this, knowing the influence of this workforce diversity on employee performance has become a very inevitable critical issue in Nepali civil service. Efficient and effective performance of civil service employee depends on the proper and sustainable management of diversity. Nepali civil service employee is positive to the organization practice of respectingdiversities and diversities and performance is a significant positive associated. Civil service employee who positively perceived organization practices to respectdiversities is more likely to be performer than who do not. Workforce diversitieshave positive influences on employee performance in Nepali civil service. Therefore, workforce diversity should be properly respected and manage for maximizing the performance of employees in Nepali civil service.
References
- lAlesina, A., & Ferrara, E. L. (2005). Ethnic diversity and economic performance. Journal of Economic Literature, 43(3), 762-800.
- Amla, M. (2017). Workforce diversity and its impact on employee performance: A study on textile industry. Imperial Journal of Interdisciplinary Research, 3(1), 1443-1449.
- Backes-Gellner, U., Veen, S. (2013). Positive effects of ageing and age diversity in innovative companieslarge- scale empirial evidence on company productivity. Human Resource Management Journal, 23(3), 279-295.
- Barak, M. E. M. (2016). Managing diversity: Toward a globally inclusive workplace. Sage Publications.
- Barton Hamilton., J. A., & Nickerson, H. Owan. (2004). Diversity and productivity in production teams. Working Paper, Washington University, St. Louis.
- Bleaney, M., & Dimico, A. (2016). Ethnic diversity and conflict. Journal of Institutional Economics, 14(7), 1- 22.
- Boehm, S. A., & Kunze, F. (2015). Age diversity and age climate in the workplace. In Aging workers and the employee-employer relationship (pp. 33-55). Springer, Cham.
- Brown, S. L. (2008). Diversity in the workplace: A study of gender, race, age, and salary level. Capella University.
- Carelse, K. (2013). Employees' perceptions towards workplace diversity in a financial institution operating in the Western Cape. Masters Dissertation submitted to University of the Western Cape.
- Cascio, W. F. (2000). Costing human resources: The financial impact of behavior in organizations Mason. OH: Thomson South-Western.
- Childs, J., et al. (2005).
- Dastane, O., & Eshegbe, J. (2015). Effect of diversity elements at workplace: An empirical study. International Journal of Accounting and Business Management, 3(1). Workforce diversity: A global HR topic that has arrived. The future of human resource management, 64, 110-118.
- Ehimare, O. A., & Ogaga-Oghene, J. O. (2011). The impact of workforce diversity on organizational effectiveness: a study of a Nigerian bank. Annals of the University of Petrosani, Economics, 11(3), 93-110.
- Elsaid, A. M. (2012). The effects of cross cultural work force diversity on employee performance in Egyptian pharmaceutical organizations. Business and Management Research.
- Eugene, C., Lee, K., Tan. S., Tee, S. & Yang, P. (2011). Effects of workforce diversity on employee performance. Journal of Social Science, 20(1), 173-198.
- Foma, E. (2014). Impact of workplace diversity. Review of Integrative Business and Economics Research, 3(1), 382.
- Frink, D. D., Robinson, R. K., Reithel, B., Arthur, M. M., Ammeter, A. P., Ferris, G. R., Kaplan, D. M., & Morrisette, H. S. (2003). Gender demography and organizat ion pe r formanc e : A two- s tudy investigation with convergence. Group & Organization Management, 28(1), 127-147.
- Garson, G. D. (2012). Testing statistical assumptions. Asheboro, NC: Statistical associates Publishing.
- Government of Nepal. (2007). Second amendment of civil service act 1993. Kathmandu Nepal: Author.
- Gupta, A. K. (2018). Accountability and performance of Nepali bureaucracy: A survey of the Ministry of Education. MPhil dissertation submitted to Kathmandu University School of Education, Hattiban Lalitpur.
- Gupta, R. (2013). Workforce diversity and organizational performance. International Journal of Business and Management Invention, 2(6), 36-41.
- Ilmarinen, J. (2005). Towards a longer work life: Ageing and the quality of work life in the European Union. Finnish Institute of Occupational Health, Ministry of Social Affairs and Health.
- Iqbal, N., Anwar, S., & Haider, N. (2015). Effect of leadership style on employee performance. Arabian Journal of Business and Management Review, 5(5). doi: 10.4172/2223-5833.1000146.
- Jackson, S. E., Joshi, A., & Erhardt, N. L. (2003). Recent research on team and organizational diversity: SWOT analysis and implications. Journal of Management, 29(6), 801-830.
- Keil, H. (2007). Psychological perspectives on workplace diversity, Handbook of Workplace Diversity, 25-52, Sage Publications.
- Kotur, B. R., & Anbazhagan, S. (2014). Education and work-experience-influence on the performance. Journal of Business and Management, 16(5), 104-110.
- Kunze, F., Boehm, S. A., & Bruch, H. (2011). Age diversity, age discrimination climate and performance consequences—a cross organizational study. Journal of Organizational Behavior, 32(2), 264- 290.
- lKyalo, J. M. K., & Gachunga, H. (2015). Effect of diversity in workplace on employee performance in the banking industry in Kenya. Strategic Journal of Business & Change Management, 2(2).
- Langran, K. R. (2002). Exploring the black box: An analysis of work group diversity, conflict, and performance, Administrative Science Quarterly, 44: 1–28.
- Lee, K., & Gilbert, B. (2014). Embedding the graduate education diversity internship (GEDI) program within a larger system. New Directions for Evaluation, 2014(143), 97-108.
- Lee, N., & Nathan, M. (2011). Does cultural diversity help innovation in cities: Evidence from London firms. LSE Research Online Documents on Economics 33579, London School of Economics and Political Science, LSE Library.
- Magoshi, E., & Chang, E. (2009). Diversity management and the effects on employees' organizational commitment: Evidence from Japan and Korea. Journal of World Business, 44(1), 31-40.
- Maingi, J. W., & Makori, M. (2015). Effect of workforce diversity on employee performance in Kenya: A case of Kenya school of government. Strategic Journal of Business & Change Management, 2(2), 52-68.
- Martin, J.N., & Nakayama, T.K. (2015). Reconsidering intercultural (communication) competence in the workplace: A dialectical approach. Language and Intercultural Communication, 15(1), 13-28.
- McMillan-Capehart, A. (2006). Heterogeneity or Homogeneity. Performance Improvement Quarterly, 19(1), 83-98.
- Munjuri, M. G., & Maina, R. M. (2013). Workforce diversity management and employee performance in the banking sector in Kenya. DBA Africa Management Review, 3(1).
- Mwatumwa, A. S. (2016). Effect of workforce diversity on employee work performance: A study of the county government of Mombasa. Masters dissertation submitted to University of Mombasa, Kenya.
- Ngao, E., & Mwangi, C. (2013). Effects of managing gender of employees in enhancing organizational performance. A case study of Kenya ports authority. European Journal of Business and Management, 5(21), 50-62.
- Odhiambo, M. W., Gachoka, H. G., & Rambo, C. M. (2018). Relationship between age diversity and employee performance of public universities in Western Kenya. International Journal of Academic Research in Business and Social Sciences, 8(11).
- O'Toole Jr, L. J., & Meier, K. J. (2011). Public management: Organizations, governance, and performance. Cambridge, UK: Cambridge University Press.
- Ozgen, C., Nijkamp, P., & Poot, J. (2011). The impact of cultural diversity on innovation: evidence from Dutch firm-level data. IZA Discussion Papers.
- Page, S. E, (2007). The difference: How the power of diversity creates better groups, firms, schools, and societies. Princeton, NJ: Princeton University Press.
- Park, H. (2013). An introduction to logistic regression: From basic concepts to interpretation with particular attention to nursing domain. Journal of Korean Ac a d emy o f Nu r s i n g , 4 3 ( 2 ) , 1 5 4 - 1 6 4 . doi:10.4040/jkan.2013.43.2.154.
- Reeda, P., & Wu, Y. (2013). Logistic regression for risk factor modeling in stuttering research. Journal of F l u e n c y Di s o r d e r s , 3 8 ( 2 ) , 8 8 - 1 0 1 . d o i : 10.1016/j.jfludis.2012.09.003.
- Richard, O. C., & Shelor, R. M. (2002). Linking top management team age heterogeneity to firm performance: Juxtaposing two mid-range theories. International Journal of Human Resource Management, 13(6), 958-974.
- Richard, O. C., & Shelor, R. M. (2002). Linking top management team age heterogeneity to firm performance: Juxtaposing two mid-range theories. International Journal of Human Resource Management, 13(6), 958-974.
- Robbins. (2009). The equal opportunities handbook: How to recognize diversity, encourage fairness and promote anti-discriminatory practice. In L. Roberson & C. T. Kuluk (Eds.). Stereotype Threat at Work, 136- 154. London: Kogan Page.
- Saxena, A. (2014). Workforce diversity: A key to improve productivity. Procedia Economics and Finance, 3 (11), 76-85.
- Selvaraj, P. C. (2015). The effects of work Force diversity on employee performance in Singapore organisations. International Journal of Business Administration, 6(2), 17.
- Tinofirei, C. (2011). The unique factors affecting employee performance in non-profit organizations. Doctoral dissertation submitted to University of South Africa.
- Van Knippenberg, D., van Ginkel, W. P., & Homan, A. C. (2013). Diversity mindsets and the performance of diverse teams. Organizational Behavior and Human Decision Processes, 121(2), 183-193.
- Veldsman, D. M. (2013). Perceptions of diversity management in a public sector. Doctoral dissertation submitted to University of the Western Cape, South Africa.
- Williams, K. Y., & O'Reilly, C. A. (1998). Demography and diversity in organizations: A review of 40 years of research. Research in Organizational Behavior, 20 (20), 77-140.
- Zenger, T. R., & Lawrence, B. S. (1989). Organizational demography: The differential effects of age and tenure distributions on technical communication. Academy of Management Journal, 32(2), 353-376.