Subscribe now to get notified about IU Jharkhand journal updates!
Financial Performance of ONGC Tripura Asset and ONGC India-A Comparative Study
Abstract :
Tripura is one of the main exertion centres of ONGC in the North-Eastern region. Tripura is the frontal forth belt of the Assam basin situated between the regions of commercial Oil & Gas reserves of upper Assam and the Gas bearing Sylhet region of Bangladesh. The study is based on the ONGC Tripura Asset which is in operation at Agartala. The study aims to analyse the performance and the financial stability of the ONGC Tripura asset, and also compares the performance growth level with the ONGC India. The study is based on three years of data for the financial year 2015-16 to 2017-18. The outcome of the study discusses the financial performance of the organisations resulting from ratio analysis.
Keywords :
Tripura, Financial Performance, ONGC, Comparative Ratio Analysis, organisations.Introduction:-
Organisational decision making necessitates
accurate analysis and interpretation of the financial
statements. Generally financial statements are
prepared for the purpose of periodical review or
assessment of progress made by management.
Measuring financial performance through financial
statements is crucial for taking actions. For every
financial expert employed in framing financial
statement, there are dozens of people interested in
analysing and using such statements, particularly
financial statements and income statements. These
people include creditors, bankers, investors,
executives and the general public. A carefully
prepared financial statement should be interpreted
in the same way for the valuable results. Along with
the rapid growth of accounting, there has been a
continuous improvement in the methods used in the
analysis of financial statements. These methods
usually establish meaningful relationships between
the assorted parts of a statement.
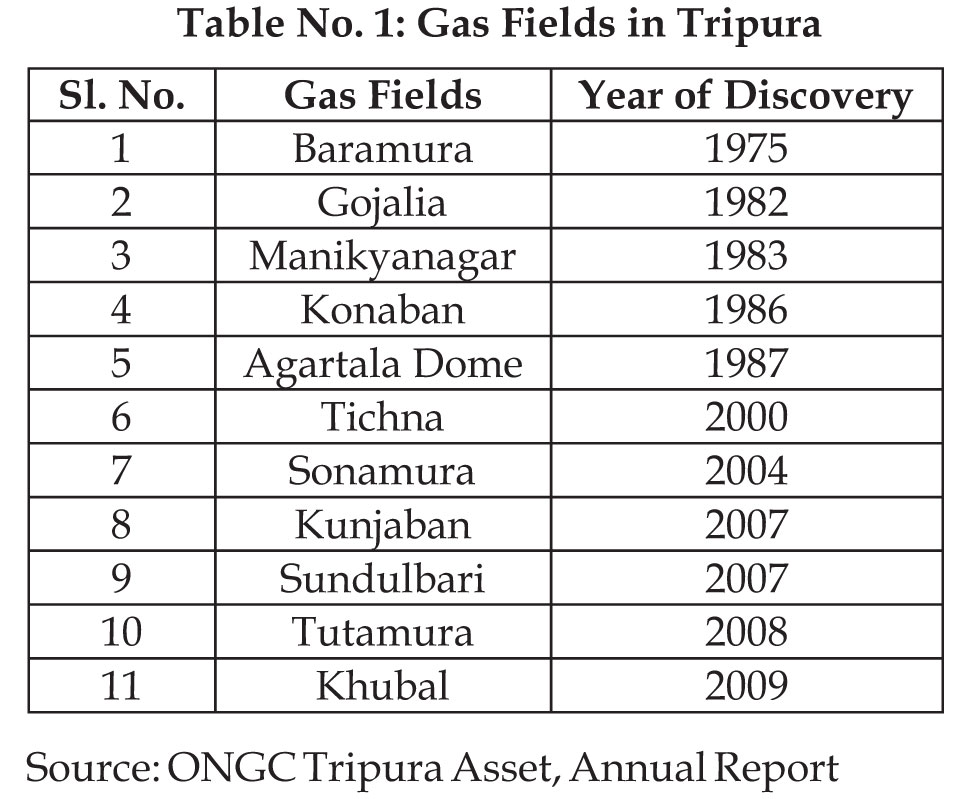
Presently ONGC is having 11 Gas fields in Tripura.
The ratio of exploration of Gas in Tripura is 2:1
(drilled 164 wells in Tripura and out of which 76
wells are yielding Gas). The Average success ratio of
ONGC Tripura is around 7:1. Gas reserves are
approximately 32 billion cubic metres. The
consumers of Tripura ONGC Assets are: ONGC
T r i p u r a P owe r C omp a n y , NE E P C O ,
MONARCHAK, RAMCHANDRANAGAR,
BARAMURA, TNGCL, ROKHIA, CITY GAS, and
TNGCL IGC.
Literature Review:
Literature review founds that, the author makes
both intra firm as well as inter firm comparative
analyses by taking five years data of HPCL
(Hindustan Petroleum Corporation limited) from
2012 to 2017 and on the financial performance of
HPCL with BPCL (Bharat Petroleum Corporation
ltd), ESSAR (Essar oil ltd), GAIL (Gas Authority of India ltd) and IOC (Indian Oil Corporation).
Applying ratio analysis technique the study verifies
that HPCL is performing better compare to many
other highly performing firms of the same industry.
HPCL is incessantly generating its resources both
financially as well as in terms of fixed assets etc. It is
continuously expanding and taking up several
projects which indicating towards the better
performance of the entity (Pudi, 2018).
Present study aims to make a comparative analysis
on financial performance of Islamic and
conventional banks of Pakistan. It is based on
convenient sampling technique. Islamic banks
(Mezan Bank Ltd, Bank Islamic and Albaraka) and
conventional banks (Faysal Bank, KASB and Bank of
Khyber) have been selected for the period 2007 to
2009. Using paired sample t-test and ratio analysis
the study found that Islamic banks are performing
better with high growth and profitability compared
to conventional banks. The study also shows that
Islamic banks are more liquid over conventional
banks and optimally utilising its resources to derive
more benefits (Usman & Khan, 2012).
Here the author attempts to analyse merge effect on
financial performance of banking and financial
institutions in Nepal. As a sample six banks and
financial institutions has been considered along with
120 respondents for primary and secondary data
respectively. Ratio analysis and t-test has been used
to analyse the data. This study found that merger
impacts performance certainly when larger and
stable parties such as commercial banks act as
bidders as opposed to the merger between smaller
banking and financial institutions, mainly other than
commercial banks as bidder. The loan quality
extensively deteriorates after merger in most of the
cases and profitability measured in terms of ROA
and ROE is adversely affected. Therefore, the study
concluded that merger should not be considered as
the definite way out to overcome the market
challenges (Shrestha, Thapa & Phuyal, 2017).
The author here examined financial statement
analysis in Tamil Nadu Newsprint and Papers ltd to
comprehend the liquidity position, for that financial
statements of last five years from 2012-2017 has been
considered. Using ratio analysis as a tool, common
size balance sheet and comparative balance sheet the
study found that the performance of the company is
positively increasing every year. Sales turnover is
also showing rising trend along with good reserve
and reputation. The study is giving positive
indications about the mentioned concern but at the
same time emphasis given on efficient and effective
management to reach the new height (Sassikala,
2018). Similar type of study has been done by the
author on financial performance of sugar industry at
Ammundi, Vellore. Period undertaken for the study
is 2013-2017. Using ratio analysis as technique the
study shows that company's financial performance
over the year is positive. It also indicates towards
profitability and good liquidity position of the
concern, which is very important for decision
making for future growth (Srinivasan, 2018).
Objective of the Study
- lTo make a comparative analysis of ONGC Tripura Asset with ONGC India based on financial performances.
Methodology
The study is descriptive in nature mainly based on secondary data, related to financial aspects of ONGC Tripura Asset and ONGC India. The data has been collected from published and unpublished sources on the subject from the office of ONGC Tripura Asset, journals, articles, related books, and financial report of the company. Period undertaken for the study is 2015-16 to 2017-18. For the purpose of analysis of collected data and to reach meaningful inferences in line with the stated objective, ratio analysis (mathematical) technique has been used. Different visual presentation techniques such as bar chart, line chart, and column chart have also been used in order to accompany the interpretation of the study.
Data Analysis & Interpretation
The study has been analysed based on the financial
performance of ONGC Tripura Asset and ONGC
India. Different ratios such as efficiency, liquidity,
profitability and solvency have been used to
evaluate various aspects of company's operational
and financial performances to draw correct
interpretation.
Source: Calculated (based on data from ONGC
Tripura Asset
& www.moneycontrol.com)
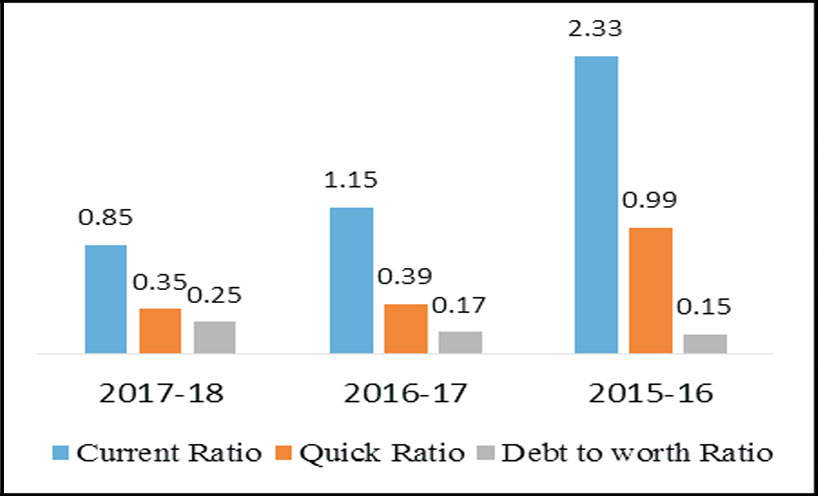
Graph 1: Liquidity Ratio of ONGC Tripura Assets
Graph 2: Liquidity Ratio of ONGC India
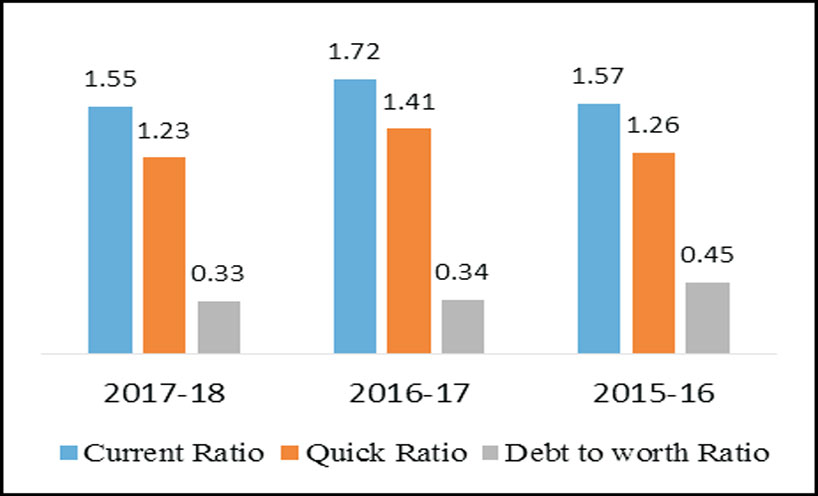
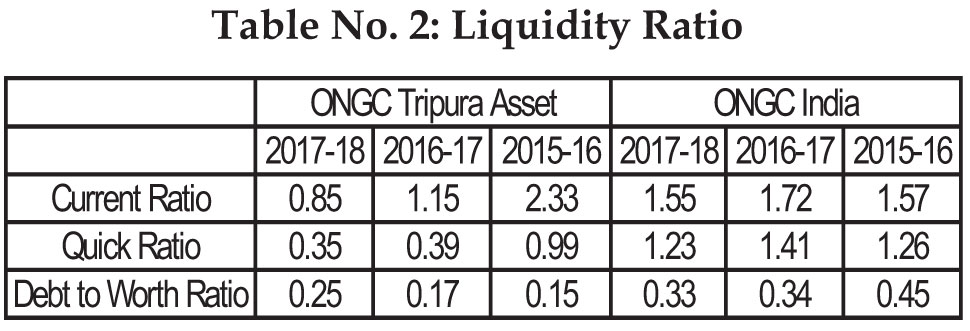
Generally, a higher liquidity index indicates that a company is more liquid and has better coverage of
outstanding debts. On the other hand higher current ratio leads to greater volume of current assets more than
the specified norm denotes that the firm possess excessive current assets than the required, depicts idle funds
invested in the current assets.Comparing ONGC Tripura asset and ONGC India the flow of current ratio of
Tripura asset shows decreasing trend, which is not at all good sign for the company. Similarly quick ratio also
shows negative trend. It may also considered that the liquid assets of the company in Tripura cannot be easily
translated into cash to meet out the urgent financial commitments, whereas the debt worth ratio indicates that
the debt amount of Tripura asset was increased but in very less volume. So the study indicates that ONGC
India is in a good position compare to ONGC Tripura Asset also there is stable deviation in the liquid ratios of
ONGC India compare to ONGC Tripura Asset.
Table No. 3 Profitability Ratio
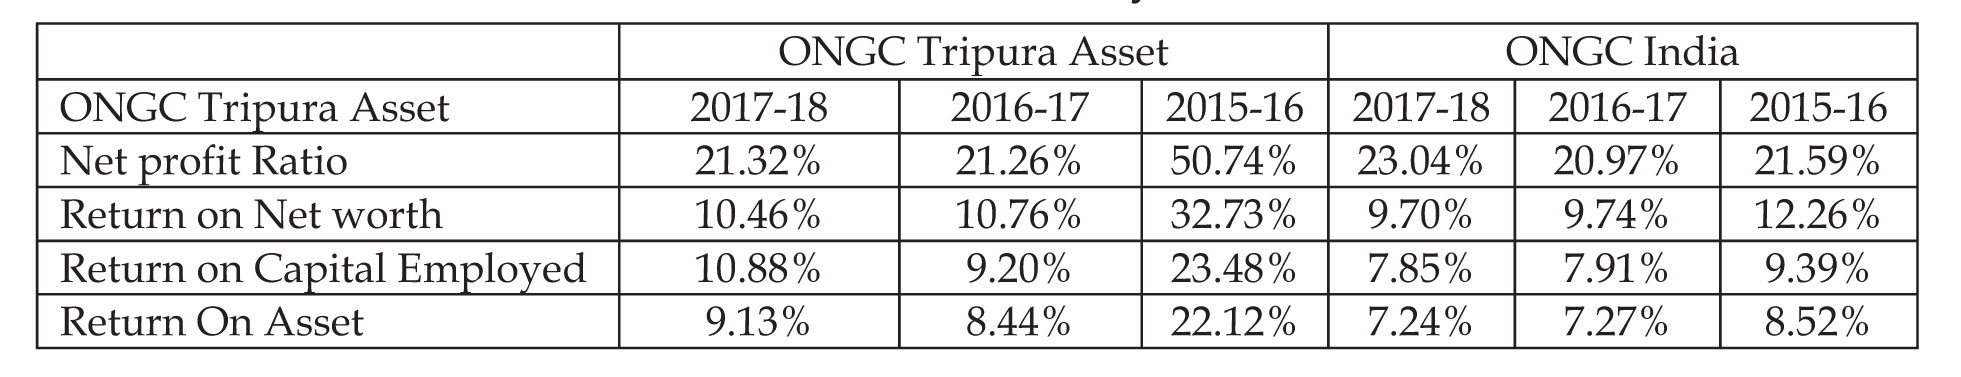
Source: Calculated (based on data from ONGC Tripura Asset & www.moneycontrol.com)
Graph 3: Profitability Ratio of ONGC Tripura Asset
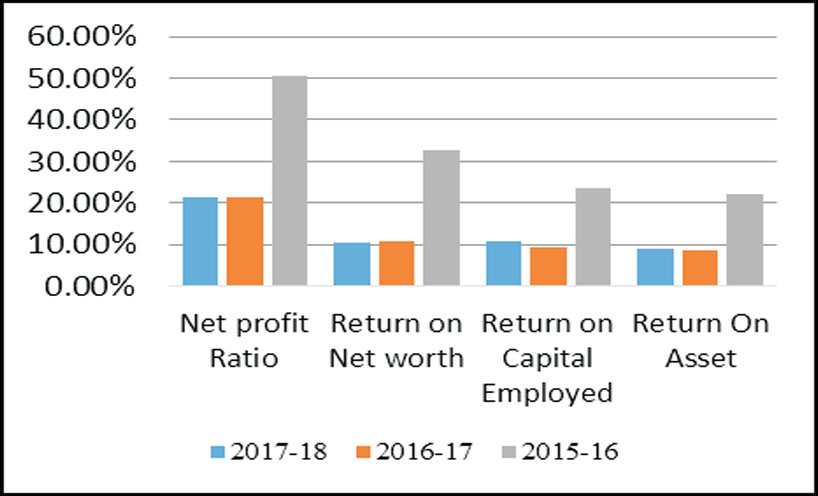
The analysis of profitability index is to measure the company's performance. The profitability of the company
is very important for stakeholders. Table 2 portrait that net profit margin of the companies declines from 2015-
16 to 2017-18 in a huge percentage, which indicate that the company overall performance was not up to the
mark. The return on net worth ratio also decreases which implies the inappropriate utilization of the
shareholder fund for earning profit. Similarly the return on capital employed and return on asset of the
Tripura asset was also decreases, which directly affects the net profit of the company. But at the same time the
study may draw one significant observation from the above analysis of
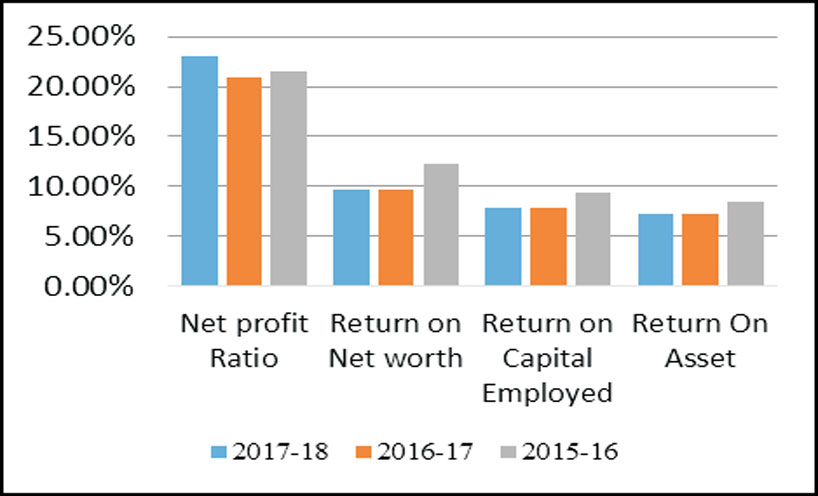
Based on the analysis of mentioned profitability ratios (i.e.Net profit ratio, Return on net worth, return on
capital employed and return on asset), the study indicates that in both the cases of ONGC India & ONGC
Tripura asset the overall profitability ratio's decline during 2015-16 to 2017-18 in large volume. But the
performance of ONGC Tripura Asset is comparatively better to ONGC India, which is a good indicator.
Table No.4: Solvency Ratio
Return on capital employed is that in
Tripura it is quite more than all India's performance of the company, which depicts that in the state of Tripura
either less capital is invested which yields high return or company efficiently using its capital. In other words,
the ratio measures how well a company is generating profits from its capital.
,br>
Based on the analysis of mentioned profitability ratios (i.e.Net profit ratio, Return on net worth, return on
capital employed and return on asset), the study indicates that in both the cases of ONGC India & ONGC
Tripura asset the overall profitability ratio's decline during 2015-16 to 2017-18 in large volume. But the
performance of ONGC Tripura Asset is comparatively better to ONGC India, which is a good indicator.
Table No.4: Solvency Ratio
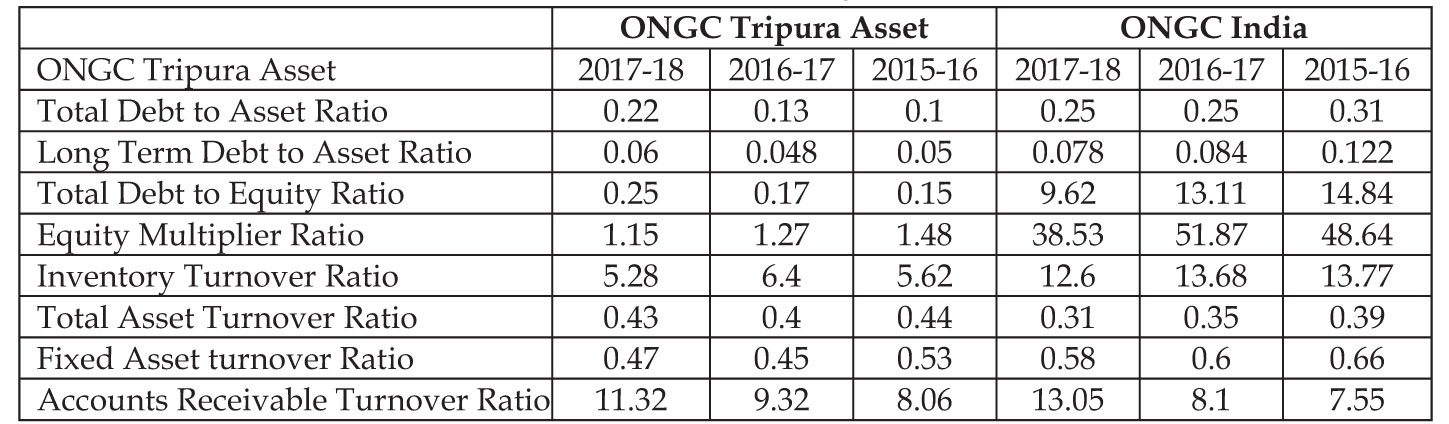
Source: Calculated (based on data from ONGC Tripura Asset & www.moneycontrol.com)
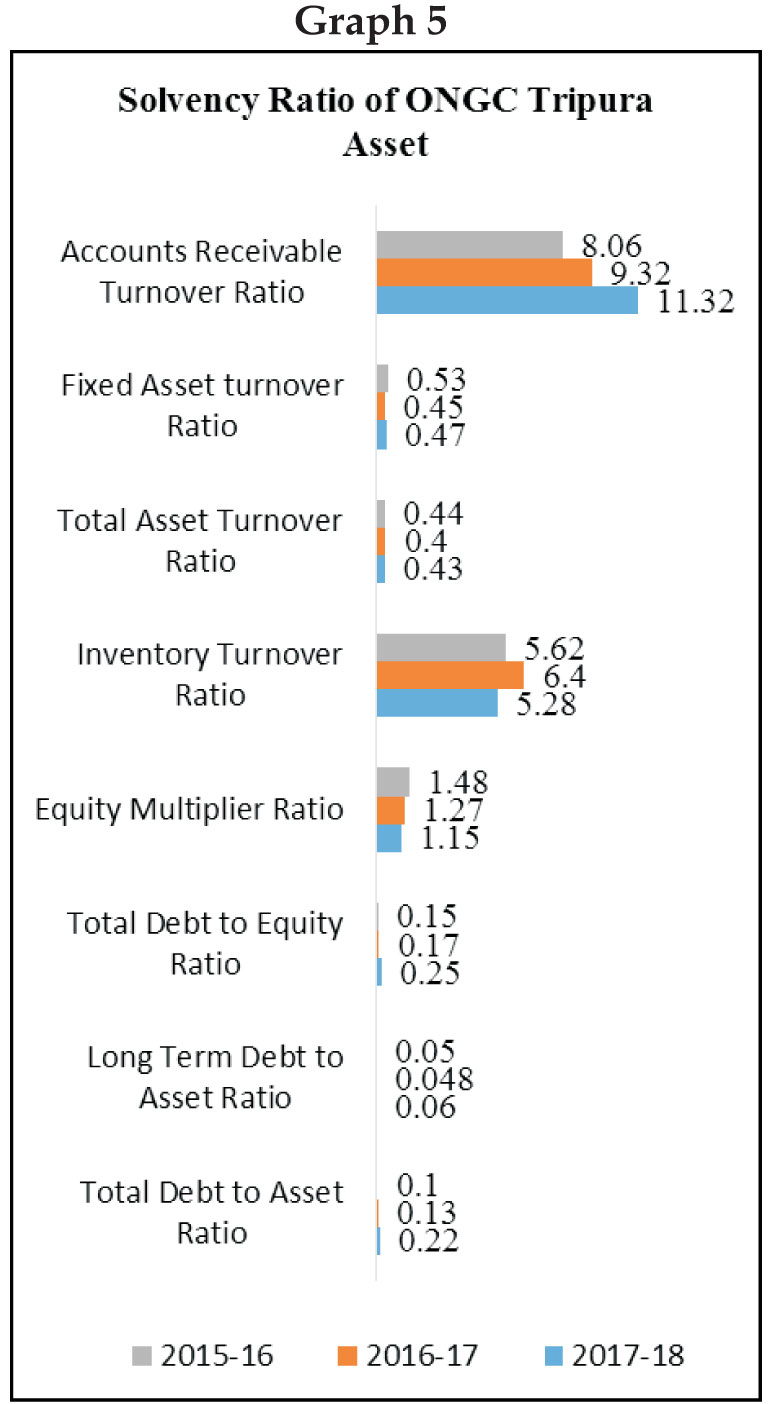
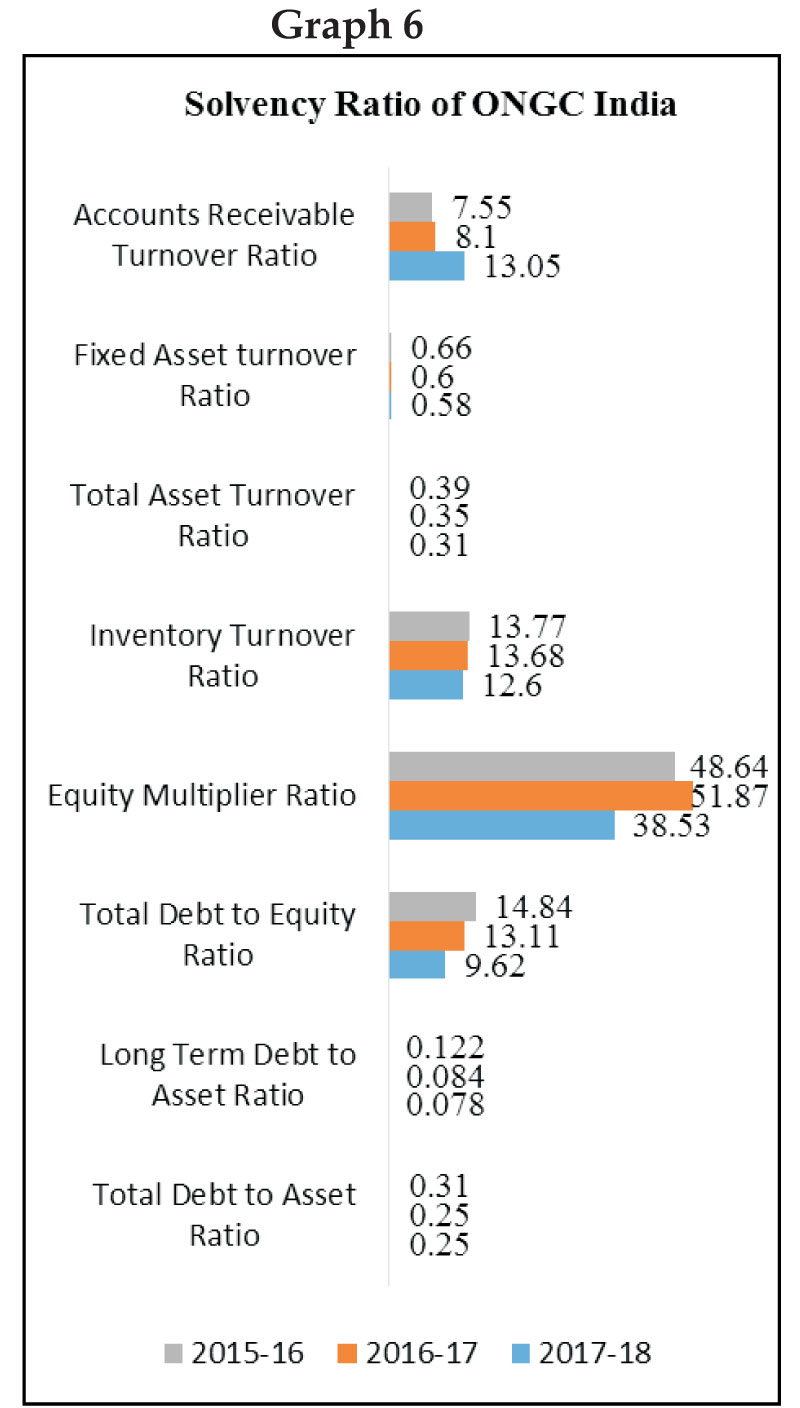
The solvency ratio is a key measure used to measure
a company's ability to meet its debt and other
obligations. The analysis of the different solvency
ratio like debt to asset ratio, long term debt to asset
ratio, and the total debt to equity ratio indicates that
the company increases every year their debt amount
but in less volume in case of ONGC Tripura Asset,
which ultimately increases the operational risk of the
company, also may effects the profit level. But on the
other hand after analyzing the equity multiplier
ratio, it shows that the company (Tripura asset) has
less dependence on debt financing for creation of
assets. Relating to inventory turnover ratio it is found
that changes are minor and close to each other, which
indicates that management system for the inventory
of the company is good that's why the inventory
turnover took place very frequently. Finally, debtors
turnover ratio, shows that in every financial year the
collection of money from debtors is prompt (2017-
18= 11.32 times, in 2016-17=9.32 times 2015-16=8.06
times) similarly in case of ONGC India too indicates
that the solvency position of the company is good.
Conclusion
The Oil and Natural Gas Corporation (ONGC) limited is well known and highly profitable PSU based company in the country. It is known for its hard work and unique ideas. ONGC has efficient man power and provides good facilities to its stakeholders. Although the overall performance of ONGC Tripura asset can be considered as satisfactory, but during the study it is found that ONGC Tripura asset slow down its performance in current years. So it is needed to upgrade level of performance, competence to reach the new height.
References:
- Khan, A. U. (2012). Evaluating the Financial Performance of Islamic and Conventional Banks of Pakistan: A Comparative Analysis. International Journal of Business and Social Science ,3 (7).
- Magina Shrestha, R. K. (2017). A Comparative Study of Merger Effect on Financial Performance of Banking and Financial Institutions in Nepal. Journal of Business and Social Science Research, 2(1),pp 47-68.
- Poongavanam, S. (2017). A Study on Comparative Financial Statement Analysis wth Reference to Das Limited. IOSR Journal Of Humanities and Social Science (IOSR-JHSS),22 (10),pp 9-14.
- Pudi, P. (2018). A Study on financial analysis through comparative statements with special reference to HPCL. International Journal Of Commerce and Management Research,4(2), pp 49-55.
- Sassikala, A. (2018). A Study on Financial Statement Analysis in Tamil Nadu Newsprint and Paper Limited, Kagithapuram, Karur. Journal of Business & Financial Affairs ,7(2): 337.
- Sharma, K. C. (2011). Performane Of Indian Public Sector Banks and Private Sector Banks: A Comparative Study. International Journal Of Innovation, Management and Technology, 2(3).
- Srinivasan. (2018). A Study on Financial Ratio Analysis of Vellore Cooperative Sugar Mills at Ammundi Vellore. International Journal of Advanced Engineering and management ,3(2), pp- 51-58.