Subscribe now to get notified about IU Jharkhand journal updates!
An Exploratory Study on Consumer Preference for OTT Viewership
Abstract :
The growth of the internet and broadband has fuelled the progress of exclusive video viewing via Over-the-Top (OTT) platforms. Many OTT providers have entered into the industry, creating chaos for consumers in selecting the right platform. The battle of differentiation has started among the players of this strategic group. Companies are expanding the markets across the globe to get more consumer share. Program differentiation, regionalised subjects, and a more extensive database of entertainment content are some of the keys for the service providers to attract more viewers to choose their services. This study throws light on the consumer decision perspective on OTTs and finds out the important factors listed by viewers. It also conveys an in-depth insight into viewer acceptance of the OTT services over traditional services.
Keywords :
Over-the-Top service, Consumer decision-making, Online streaming, viewershipI. Introduction
Traditionally consumers watch television through cable or satellite. With the emergence of high-speed internet, consumers prefer to watch it online. Online streaming, also known as Over-the-top (OTT) medium, where consumers watch a program online, has become an alternative to pay-tv. OTT has transformed consumer viewing like never before. Germination of high-speed internet with the decline in price and growing access to smartphones are factors responsible for the growth of the OTT industry. OTT medium is a primary instance of whence digitisation is revamping a revolution in the entertainment sector. The transition is fundamentally impelled by fast-advancing mobile telephone technology, the growing inflow of latest gadgets like smart TVs, tablets, cost-effective speed internet, and unlimited access and customer preference for different and fresh content. The growth of OTT is leading to a change in the video viewing behaviour of Indians. Concurrently, it is further accelerating progress in the abundance of OTT video programs affecting different and fresh content worldwide to the Indian viewers.
The OTT market in India is expected to reach USD 15 billion by 2030, as per a report published by the transaction advisory agency, RBSA advisors. It would include the video OTT market (USD 12.5 billion) and audio OTT (USD 2.5 billion).In 2020, the size of the Indian OTT market was about USD 1.7 billion. As per the KPMG report, the number of online video viewers in 2018 was about 225 million and is expected to touch about 550 million by 2023. The OTT revenue in 2018 was INR 21.5 billion and is expected to reach about INR 138.1 billion in 2023. OTTs earned revenue through advertising and consumer subscriptions. Some OTTs offered free subscriptions, while others charged a subscription fee to the consumers. In 2018, the revenue share of advertising and subscription was 80% and 20%, respectively. However, the subscription-based revenue is expected to rise further, and the advertising-based revenue is anticipated to decline from 80% in 2018 to 67.5% by 2023.
India had more than 30 OTT players in 2021. OTT players generate revenues from online advertising and subscription from consumers. Some OTT players even offer consumers to watch the content at free cost. The industry had international players like Netflix, Amazon Prime, Sony LIV, and domestic players like Hot star, ZEE5, ALT Balaji, Eros Now, and many more. Players in this strategic group have been battling to reduce subscription costs, produce fresh content, and develop an extensive archive of content localisation programs. OTT players, including domestic and global, have offered content in regional languages like Hindi and others. Hoichoi, an OTT service provider, offered content only in the Bengali language. In this context, understanding consumers viewing behaviour is crucial for the players.
Literature Review
Primarily television provides the advantages of relaxation and mood lift except for the need for interaction with the set. It is primarily thriving as a storytelling tool and less interactive device. It is expected that it would be interactive in the future while retrieving the information, making it a more interactive medium. Interactive television would obtain distinct approaches to meet the appetite for communicative and experimental interests, interactive entertainment, and additional services like interactive shopping. (Lee & Lee, 1995).
The growth of broadband infiltration and screen accessibility has advanced the growth of premium video by OTT services. The rapid growth of broadband and the rise of several distribution mediums led consumers to watch high-quality videos through OTT services. OTT service is originated from the idea of a television set-top box and allocates the program utilising Internet Protocol across a public network (Goncalves & et al., 2014).
Technology has transformed students' approach to watching television programs. Mobile phones allow them to watch various sorts of entertainment possibilities. College goers mostly prefer to watch television online while using digital video recorders. The extent of video viewership multiplies by hours per day by using online access and digital video recorders (Damratoski& et al., 2011).
Younger people (less than 35 years) are more likely to watch videos online by subscribing to OTT services than people more than 35 years of age. Traditional cable companies are facing stiff competition from the OTT players. The subscription price is a salient trait in the consumer buying decision. The cable companies have to keep the price low to compete with the OTT players and attract more customers. Customer service is an essential attribute for consumer delight. Social trends influence consumers to view online streaming (Lee & et al., 2018).
Netflix, a pioneer international OTT company from the US, extended its market worldwide and penetrated the Asian nations. In China and Korea, viewers subscribe to OTT services due to the essential characteristics of the medium, like resolution, recommendation system of videos, and viewing options. Chinese viewers select resolution as the essential trait in the OTT services followed by the recommendation approach and watching preferences, whereas Korean viewers prefer the recommendation policy first supported by viewing prospects and resolution (Kim & et al., 2017).
Due to technology and digitalisation, viewers get access to more screens with exclusive content. The monopoly of conventional television on video content has been lost because of more screens and content quality. Viewers demand a better-quality signal with superior features at an economical rate. Competition among the players become intense to offer advanced service at a lower cost. (Baccarne, Evens & Schuurman, 2013).
Traditional televisions and pay-TV are facing intense rivalry from OTT players due to the streaming or download access to the video content online. Consumers are likely to migrate from non-pay TV to cord couplers due to mainly availability and use of smart devices like smartphones, laptops, and others (Banerjee, Alleman &Rappoport, 2013).The device plays a critical part in transferring users from conventional TV to online streaming. Portable smart tools like smartphones are convenient for greater interactivity for OTT services (Lee & et al., 2018).
Consumers spend a shorter time on cable TV and games due to spending more time on online videos in South Korea. They prefer to watch the broadcast and network content online instead of cable TV. They consume more time online to watch programs and less time for cable TV and games. Online videos have become a substitute for cable TV due to making the broadcast content available online by cable TV players (Lee & Lee, 2015).
Users access the broadcasting program on computers, cell phones, and tablets at their convenience time and place. Traditional broadcasting players and internet service firms are penetrating the OTT service market and battling with each other for market dominance. Viewers prefer watching programs through real-time broadcasting. If the terrestrial television companies do not share their content with additional online service providers, the online and pay-TV players could strengthen market share by reducing the cost and extending the amount of Video-on-demand (Shin, Park & Lee, 2016).
Consumers expect higher quality videos from the online program. Buffering time affects consumers negatively while watching a program. The increase in buffering time affects all contents online. It lessens consumer engagement for various kinds of programs. For instance, a one per cent rise in buffering ratio declines consumer viewing by longer than three minutes for 90 minutes' online video program (Dobrian& et al., 2013).
It is necessary to measure the channels' inter-channel relationship if distinct channels distribute a particular television program. The program's viewing rate is favourably associated with its total streaming time and impacts well among the television distribution channels (Sung &Kwack, 2016).
Understanding consumer decisions is imperative with the existence of both traditional television services and emerging mediums. Users accept conventional television despite online streaming serve similar requirements. However, they would be likely to use a particular online video platform over traditional television if they get distinct advantages and compatibility with the online platform. Consumers will use the online platform more if they perceive it provides exclusive benefits. The unique benefits and adaptability of online platforms lessen the possibility of accepting television (Cha, 2013).
OTTs extend their services to a more extensive global audience. Most OTTs offer English subtitles in their videos. Subtitles were a national phenomenon initially and later became international with the rise of commercial television and DVD. Now with online streaming, it is a global aspect. Netflix, a global pioneer OTT company, adds videos of regional languages while serving that region. It follows customisation by adding regional standards and local practices (Pederson, 2018). OTTs like YouTube offers its service in various languages. Netflix provides videos in Hindi and other regional languages as part of its localisation strategy in India (Mohan &Punathambekar, 2019).
Research Problem & Objectives
- To understand consumer's behaviour for Over-the-top services.
- To explore the variables that affect viewers' characteristics in choosing a particular OTT service provider and their association.
- To explore the areas of concern for the OTT platform based on the viewer’s opinions.
Research Design
The type of research is 'Exploratory' only. The authors have attempted to discover the variables constructing the change in the preference pattern of viewers. As derived from the earlier studies and related initiatives on OTT viewership, the study emphasised certain factors likeuser-friendly technology (gadgets like smartphones), expected benefits (accessibility at any place, exclusive content),the popularity of OTT service providers (famous players both national and international), category-specific services (content specificity, content differentiation vis-à-vis programs and regional flavours like language. A statistical tool like correlation analysis is used to analyse the data and create inference.
Data collection
The authors have collected data through a structured questionnairecomprising closed-ended questions with a five-point Likert scale represented by ‘Least important’ as point 1, ‘Not that important’ as point 2, ‘Not sure’ as point 3, ‘Somehow important’ as point 4 and ‘Most important’ as point 5. For the study, the sample size was 200 subscribers of OTT video services.For this research, sampling followed a mixture of convenience-cluster types of non-random sampling and did not involve any stratification. A computer-assisted 'Survey Questionnaire' was used to translate research objectives into precise questions, standardise the precise questions, categorise the responses, and expedite the analysis of collected data.
Research Framework and Hypotheses
The framework of this research includes adaptations from prior research studies and theories for testing hypotheses. The hypotheses identified for this research are as under:
- Hypothesis-I: ‘User-friendly technology’ is positively related to ‘Reason for viewing.'
- Hypothesis-II: ‘Popularity of service provider’ is positively related to ‘Reason for viewing.'
- Hypothesis-III: ‘Expected benefit is positively related to the ''Popularity of service provider.'
- Hypothesis-IV: ‘Category-specific service’ is positively related to ‘Expected benefits.'
Measuring the Variables
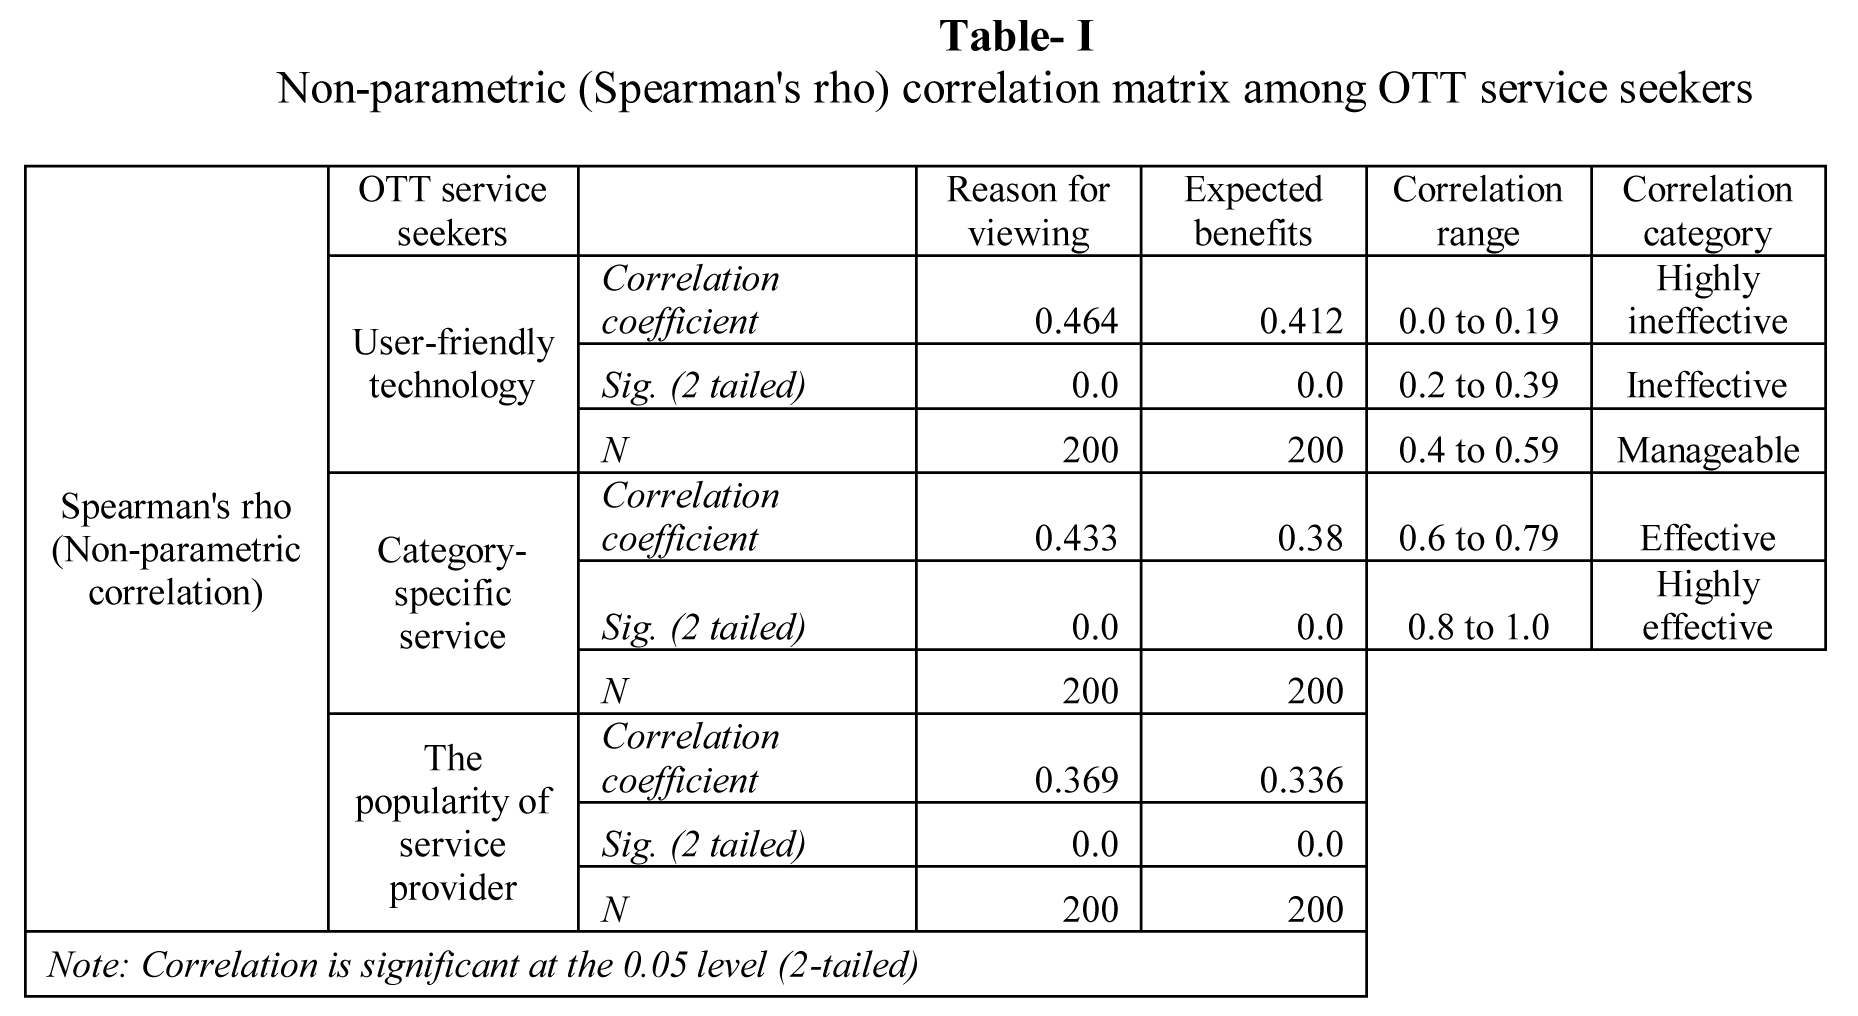
The authors have used Spearman's rank correlation for analysis because of measuring the ordinal level of data. This method is a non-parametric test used for explaining the dependence between two variables. It is a counterpart of the Pearson correlation coefficient. With a value ranging between -1 and +1, the Spearman correlation is primarily used to recognise and examine the strength of association between two data sets. It is also typically used to either verify or contradict a hypothesis. With the use of SPSS (13.0), the result obtained from this study's data is shown in Table – I. The strength of Spearman's correlation is categorised into the following categories:
- 0.00-.19 indicates “Highly ineffective."
- 0.20-.39 indicates “Ineffective."
- 0.40-.59 indicates “Manageable."
- 0.60-.79 indicates “Effective."
- 0.80-1.0 indicates “Highly effective."
- A sample size of 200 is a limitation of the study.
- Moreover, the study indeed calls for thorough research on this issue, and the researcher is short of time and space at this point.
- Baccarne, B., Evens, T., & Schuurman, D. (2013). The television struggle: an assessment of over-the-top television evolutions in a cable dominant market. Communications & strategies, (92), 43-61.
- Banerjee, A., Alleman, J., &Rappoport, P. (2013). Video-viewing behaviour in the era of connected devices. Communications & Strategies, (92), 19-42.
- Cha, J. (2013). Predictors of television and online video platform use: A coexistence model of old and new video platforms. Telematics and Informatics, 30(4), 296-310.
- Damratoski, K. J., Field, A. R., Mizell, K. N., & Budden, M. C. (2011). An investigation into alternative television viewership habits of college students. Journal of Applied Business Research (JABR), 27(1).
- Dobrian, F., Sekar, V., Awan, A., Stoica, I., Joseph, D., Ganjam, A., ... & Zhang, H. (2011, August). Understanding the impact of video quality on user engagement. In ACM SIGCOMM Computer Communication Review (Vol. 41, No. 4, pp. 362-373). ACM.
- Goncalves, V., Evens, T., Alves, A., Ballon, P. (2014). Power and control strategies in online video services. In Proceedings of the 25th European regional conference of the international telecommunications Society(ITS). Belgium, June 2014, 22–25.
- Kim, J., Kim, S., & Nam, C. (2016). Competitive dynamics in the Korean video platform market: Traditional pay-TV platforms vs OTT platforms. Telematics and Informatics, 33(2), 711–721.
- Kim, M. S., Kim, E., Hwang, S., Kim, J., & Kim, S. (2017). Willingness to pay for over-the-top services in China and Korea. Telecommunications Policy, 41(3), 197-207.
- Lee, C.C., Monsam, A., Falla., P., Ghiloni-Wage, B. (2018). Consumer behavior of over-the-top television service subscribersNortheast Decision Sciences Institute 2018 Annual Conference, Providence, Rhode Island, USA.
- Lee, C. C., Nagpal, P., Ruane, S. G., & Lim, H. S. (2018). Factors Affecting Online Streaming Subscriptions. Communications of the IIMA, 16(1), 2.
- Lee, S. Y., & Lee, S. W. (2015). Online video services and other media: Substitutes or complement. Computers in human behaviour, 51, 293-299.
- Mohan, S., &Punathambekar, A. (2019). Localising YouTube: Language, cultural regions, and digital platforms. International Journal of Cultural Studies, 22(3), 317-333.
- Shin, J., Park, Y., & Lee, D. (2016). Strategic management of over-the-top services: Focusing on Korean consumer adoption behaviour. Technological Forecasting and Social Change, 112, 329-337.
- Sung, N., &Kwack, E. (2016). IPTV's videos on demand for television programs, their usage patterns, and inter-channel relationship in Korea. Telecommunications Policy, 40(10-11), 1064-1076.
- Pedersen, J. (2018). From old tricks to Netflix: How local are interlingual subtitling norms for streamed television?. Journal of Audiovisual Translation, 1(1), 81-100.
- Jha, Lata. (2021, July 15). Streaming market in India to be worth of $15 billion by 2030. Retrieved August 8, 2021, from https://www.livemint.com/industry/media/indias-streaming-market-to-be-worth-15-billion-by-2030-11626350404092.html
- (2017, October). The Digital First Journey. KPMG report 2017, kpmg.com,Retrieved July 5, 2021, from https://assets.kpmg/content/dam/kpmg/in/pdf/2017/10/The-Digital-First-journey.pdf
- (2018, October 26). OTT video – Small screen, big play. Ibef.org, Retrieved July 6, 2021, from https://www.ibef.org/research/india-study/ott-video-small-screen-big-play
- (2018, September 1). KPMG in India’s Media and Entertainment Report 2018. kpmg.com,Retrieved July 7, 2021, from https://assets.kpmg.com/content/dam/kpmg/in/pdf/2018/09/Media-ecosystems-The-walls-fall-down.pdf
- Saha, M. (2018, December 17). Is the Indian OTT consumer ready to pay? exchange4media.com, Retrieved July 7, 2021, from https://www.exchange4media.com/digital-news/is-the-indian-ott-consumer-ready-to-pay-93502.html
- Paliwal, S. (2019, September 12). Apple TV+ to launch in India: Should OTT players worry. exchange4media.com Retrieved July 8, 2021, from https://www.exchange4media.com/digital-news/apple-tv-to-launch-in-india-should-ott-players-worry-99485.html
- Bhattacharya, Ananya. (2019, January 16). Netflix hasn’t increased prices in India probably because it can’t afford to. Quartz India. Retrieved July 8, 2021, from https://qz.com/india/1525269/amazon-prime-hotstar-rival-netflix-didnt-raise-prices-in-india/
- Das, A. (2019, May 20). India’s Growing Regional Language User Base Driving Up Investments in OTT Space. inc42.com, Retrieved July 14, 2021, fromhttps://inc42.com/datalab/indias-growing-regional-language-user-base-driving-up-investments-in-ott-streaming-space/
- Bhattacharya, A. (2019, July 11). For Netflix, being a premium service in India has its perks. Quartz India, RetrievedJuly 15, 2021, fromhttps://qz.com/india/1656626/indian-users-spend-more-on-netflix-than-hotstar-says-kalagato/
Descriptive Statistics
Coming to descriptive statistics, data obtained from the survey indicates that in most cases, the median scores obtained for Viewership Preference via OTT Service are at 4 (i.e., 45% of responses say ‘Somehow important’) or 5 (i.e., 45% of responses say ‘Most important’) whereas 2 (i.e., 10% of responses say ‘Not that important’). On the other hand, the mode scores indicate the predominance of option 5 (i.e., 65% of responses favouring ‘Most important'), whereas 20% of responses are at 4 (‘Somehow important’).
KMO and Bartlett's Test
To understand the adequacy of sampling under measurement, Kaiser-Meyer-Olkin (KMO) and Barlett's test of sphericity was used. In KMO, sampling adequacy statistics output ranges between ‘0’ and ‘1’, representing a high number of inequitable correlations against the sum of correlations and a high level of packed correlations with relevant and consistent factors, respectively. Value in excess of 0.5 is always recommended for suitability.
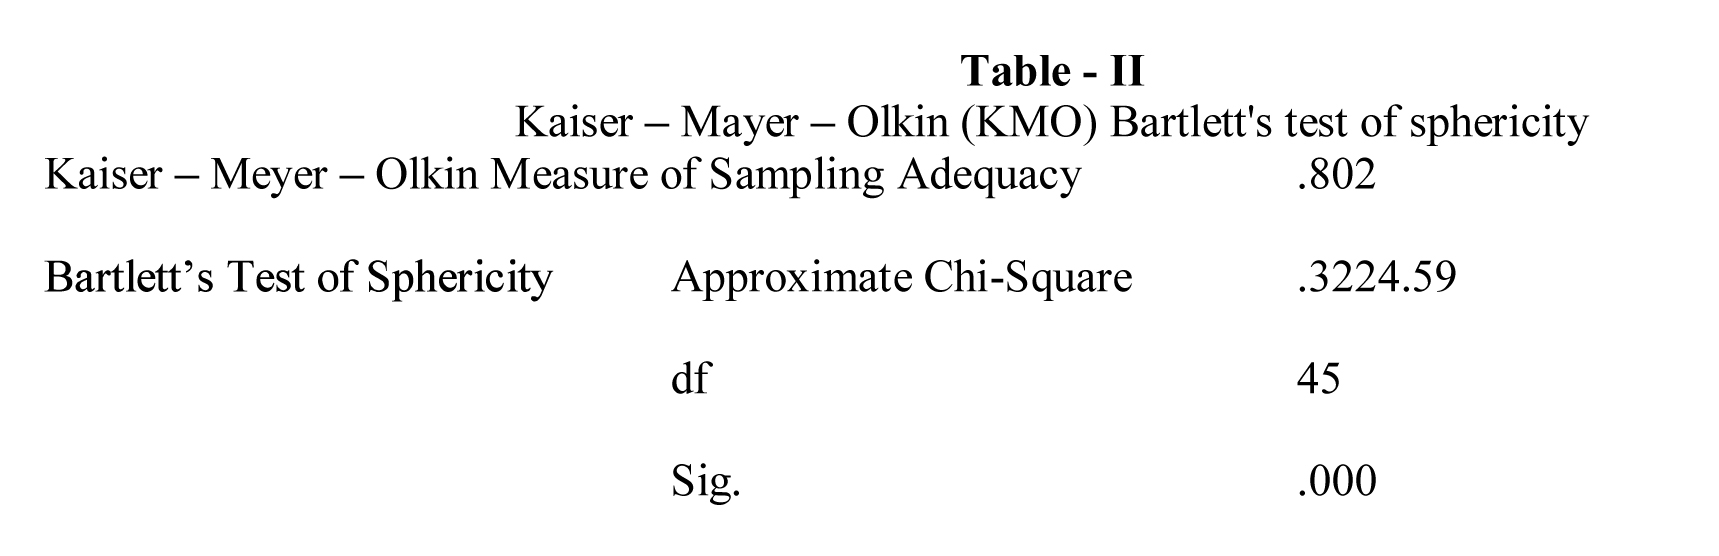
With a sampling adequacy value of 0.802 (as shown in Table – II), more than the recommended level of 0.5, the tests were found to be significant, i.e., p < 0.001 as taken from the output of Bartlett's Test of Sphericity.
Correlation Analysis
For Hypothesis-I, the Spearman's correlation coefficient indicates a positive relationship between 'User-friendly technology’ and ‘Reason for viewing' at 0.464, p<0.05 suggesting that 'User-friendly technology'' with OTT, the better will be the ‘Reason for viewing.' Similarly, in the case of Hypothesis-II, the two-tailed test of significance shows a positive relationship between 'Popularity of service provider’ and ‘Reason for viewing’ at 0.369, p<0.05, indicating augmentation in the ‘Popularity of service provider’ through OTT, ‘Reason for viewing’ can also take an upswing. Coming toHypothesis-III, thereis a positive relationshipbetween ‘Expected benefits’ and ‘Popularity of service provider,' i.e., 0.336 with p<0.05 indicating that increase in ‘Expected benefits’can increase the ‘Popularity of service provider.' Finally, for Hypothesis - IV, the two-tailed test of significant results shows a positive relationship between 'Category-specific service’ and ‘Expected benefits’ with a value of 0.380 at p<0.05.
In addition to understanding the situation of positive relationships, the strength of category-specific is evaluated. For example, in Hypothesis-I, although Spearman's correlation coefficient is 0.464 at p<0.05, suggesting positive relation; however, the strength of scores falls within the 'Manageable’ level. Similarly, for Hypothesis-II, a score of 0.369 at p<0.05 indicates the strength of scores fall to be falling within the 'Ineffective' zone. For Hypothesis – III, a scoreof 0.336 at p<0.05, the strength again is found to fall within the 'Ineffective’ zone. The exact strength applies to Hypothesis- IV, wherein the Spearman’s correlation coefficient of 0.380 at p<0.05 indicates a positive relation, but the scores fall within the 'Ineffective’ zone. Various reasons like target audience, kind of program, streaming time influence the strength of the score. Therefore, any change in the said reasons may not produce similar results.
Limitations
Conclusion
With a scope of few bigotry factors and individualised opinions of responses giving us a partial expected result of the study, the spectrum of the latter can be expanded in the near future. It is required to understand the changing dimension of viewership as time progresses because of changing technology, the strategies of service providers, tastes, and viewers' preferences.The study of the OTT industry has a vast scope that encompasses depth insights from consumer perspectives will be helpful for the service providers. The study will give the essential attributes that help consumers in choosing a particular OTT service provider.
References