Subscribe now to get notified about IU Jharkhand journal updates!
A Comparative Study Of Select ‘Beyond GDP’ Measures
Abstract :
GDP has been the most used and abused measure of a country's performance and its misuses led to development of various new measures that incorporate variables that are purportedly better at measuring development and include social and environmental aspects of progress. We analyze three select measures – Gross National Happiness Index (GNHI), Legatum Prosperity Index (LPI), and Sustainable Development Goals (SDGs) – discussing commonalities and differences among them. The analysis will help researchers and policymakers assess relative strengths and weaknesses of the measures and adapt suitable one for policy formulations. While GNHI is custom-made for Bhutan making its adaptation by other countries an arduous task, SDGs are a set of indicators to be adapted by individual countries and compute their own indices rendering SDG indices incomparable across geographies. Revised LPI is very broad based and includes many facets of human life that are not present in other indices making it more suitable for comparing progress across time and space.
Keywords :
gross domestic product, gross national happiness, Legatum prosperity index, measures of prosperity, sustainable development goals.I. Introduction
Sir William Petty is widely credited with first use of the term ‘national income’. He used the consumption method to estimate national income of England, in 1665, while breaking it down into income drawn as rent and income earned as wages. (Petty, 1899) His method was later improved upon by his disciples Gregory King and Charles Davenant. But the credit for developing and refining the concept, using modern terminology, goes to Simon Kuznets. In spate of the Great Depression, the 73rd US Congress charged Kuznets with creating a system that would measure the country’s productivity so that the Depression could be tackled in a better way. (Kuznets, 1934) In his report to the US Congress, while defining the concept of national income, Kuznets points out the potential abuse of the concept. “The welfare of a nation,” he warns, “can, …scarcely be inferred from a measurement of national income…”. He lays down two explicit economic qualifications to the use of the term concept: one, the concept only measures things that explicitly appear on the market, and two, such market valuations depend on the ‘personal distribution of income within the nation.’ Despite Kuznets unambiguous warning, the concept of Gross National Product (GDP), popularized by the Bretton Woods conference, became the standard tool for measuring an economy’s progress. (Dickinson, 2011)
Alfred Marshall introduced the concept of utility and its measurement in economic thinking. The argument advanced is that anything that changes hands, i.e., is traded, is done so only on the basis of utility that it provides to the traders. Such an exchange is not possible without the measure of utility being agreed upon the traders. This makes ‘price’ the centerpiece of all recorded transactions leaving out two important spheres of activity outside the realm of measurements and, thus, not recorded – community (society/family) and environment (nature/natural resources). This is precisely what Kuznets points out to in his first caveat to the judicious use of GDP. Kuznets’ second caveat implies that GDP in itself is an inappropriate measure for comparing two economies in terms of their development or even growth. Since, the GDP is essentially a price weighted index of output, two economies can have the exact same values of GDP and have a vastly different combination of prices and outputs. But, it is the combination of prices and outputs that define the nature and characteristics of distribution of income and wealth in an economy. Thus, comparing two economies with different distribution characteristics on the basis of GDP is similar to comparing apples with oranges on the basis of weights that one bought them of and ignoring their inherent differences in taste, texture, nutrients, etc.
Despite its shortcomings, GDP remains a much-used measure. The appeal of GDP lies in the simplicity of its calculation, directness of its definition, objectivity of being based on manifest prices, and hence, its near universal applicability. GDP, therefore, rightly deserves its place as a useful tool for measurement and assessment of economic policy and reforms. But, the it must not be confused with being a measure of ‘progress and development’; growth in GDP does not imply a growth in sustainable welfare of the people. A distinction must be made between ‘growth’ and ‘development’. One of the clearest expositions of the difference between the two concepts is as follows:
“To grow means to increase naturally in size through the addition of material through assimilation or accreditation. To develop means to expand or realise the potentialities of; bringing gradually to a fuller, greater or better state. In short, growth is the quantitative increase in physical scale while development is qualitative improvement or the unfolding of potentiality. An economy can grow without developing, or develop without growing, or do both, or neither.” (Daly, 1996)
The World Bank asserts that “in order for development to continue indefinitely, it should balance the interests of different groups of people, within the same generation and among generations, and do so simultaneously in three major interrelated areas–economic, social, and environmental.” (Soubbotina, 2004) GDP is simply not an indicator of the linkages between economy, society, and environment.
BEYOND GDP
True reflection of an economy’s health – wealth and well-being – cannot be measured by GDP. An index that goes beyond GDP and includes social and environmental costs and benefits is what is desired. Dissatisfaction with GDP’s limitation has led academicians, researchers, and policy-makers alike, to attempt to develop new measures and indicators. Numerous such studies have been conducted and many a measure and indicator proposed. Such measures and indicators
– alternatives to GDP – have been variously categorized based on their characteristic features. One such classification, proposed by Boston University’s Fredrick S. Pardee Center for the Study of the Longer-Range Future, groups the indices into four categories: (a) indices that make ‘corrections’ to GDP, (b) indices that measure the aspects of well-being directly, (c) composite indices, and (d) indicator suites. (Costanza, Hart, Posner, & Talberth, 2009) ‘The Beyond GDP Conference’ organized jointly by the European Commission, European Parliament, Club of Rome, the Organization for Economic Co-operation and Development (OECD), and the World Wildlife Fund (WWF) in November, 2009, strove to arrive at clarity regarding indices that were most appropriate for measuring progress. It classified the alternatives to GDP as the ones (i) adjusting GDP, (ii) replacing GDP, (iii) supplementing GDP based on national accounts systems, and (iv) supplementing GDP based on social and environmental information. (Goossens, et al., 2007) Both the above-mentioned classification schemes have categories that roughly correspond to each-other. While all four categories, in both classification schemes, have their respective merits and demerits, the indices in the first category suffer from most of the same deficiencies that GDP does. This paper, therefore, focuses on analyzing indicators that fall in the rest of the three categories and selects one measure from each of them: Gross National Happiness Index (GNHI) of Bhutan (from among the indicators in second category), the Legatum Prosperity Index (LPI) of the Legatum Institute (from among the indicators in third category), and the Sustainable Development Goals (SDGs) of the United Nations (from among the indicators in the fourth category).
GROSS NATIONAL HAPPINESS INDEX
The contested (Munro, 2016), yet widely accepted, origin of the idea of Gross National Happiness (GNH) attributes it to have been first articulated by the fourth King of Bhutan, Jigme Singye Wangchuck, in 1972. (Ura K. , Alkire, Zangmo, & Wangdi, An Extensive Analysis of GNH Index, 2012) The concept, at first, was little more than a political construct and did not get any considerable traction even in Bhutan government’s official records before 1996 when it first made an appearance in the 24-page document, National Budget 1996-97, under the section titled “environmental policy”. Happiness did not become a regular feature of the national budget documents before 2002-03. Meanwhile, the promotion of national happiness as a concept originating in Bhutanese tradition began in all earnestness in the academic and international circles with the establishment of a semi-government think-tank, the Centre for Bhutan Studies (CBS) in 1999 with generous support from the Royal Government of Bhutan. (Munro, 2016) Bhutan’s Ninth Five-Year Plan (Planning Commission, 2003) first placed the idea of Gross National Happiness in the domain of development philosophy, the Tenth Plan (Gross National Happiness
Commission, 2008) consolidated the idea with numerous references to it throughout the policy document, and the Eleventh Plan (Gross National Happiness Commission, 2013) contained detailed references to the GNH Index, the first of which was published in 2010. The Tenth Plan also marked the transformation of the Planning Commission into the ‘Gross National Happiness Commission’. The newly christened Commission was mandated to ensure that all development projects and policies get clearance from the GNH perspective. (Gross National Happiness Commission, 2017)
Surprisingly, such highly publicized, pervasive, and all-encompassing development philosophy has no single official definition. Nevertheless, it is asserted that the following definition is a widely used one:
Gross National Happiness measures the quality of a country in more holistic way [than GNP] and believes that the beneficial development of human society takes place when material and spiritual development occur side by side to complement and reinforce each other. (Ura K. , Alkire, Zangmo, & Wangdi, An Extensive Analysis of GNH Index, 2012)
At the very outset, it must be understood that Bhutan’s philosophy of GNH, and the index that is based on it, is something that is singularly unique to Bhutan’s socio-cultural-religious milieu. The idea of happiness, the very core of the philosophy, emanates from the set of religious and moral values that Bhutan’s version of Buddhism exudes.
COMPONENTS OF THE GNH INDEX
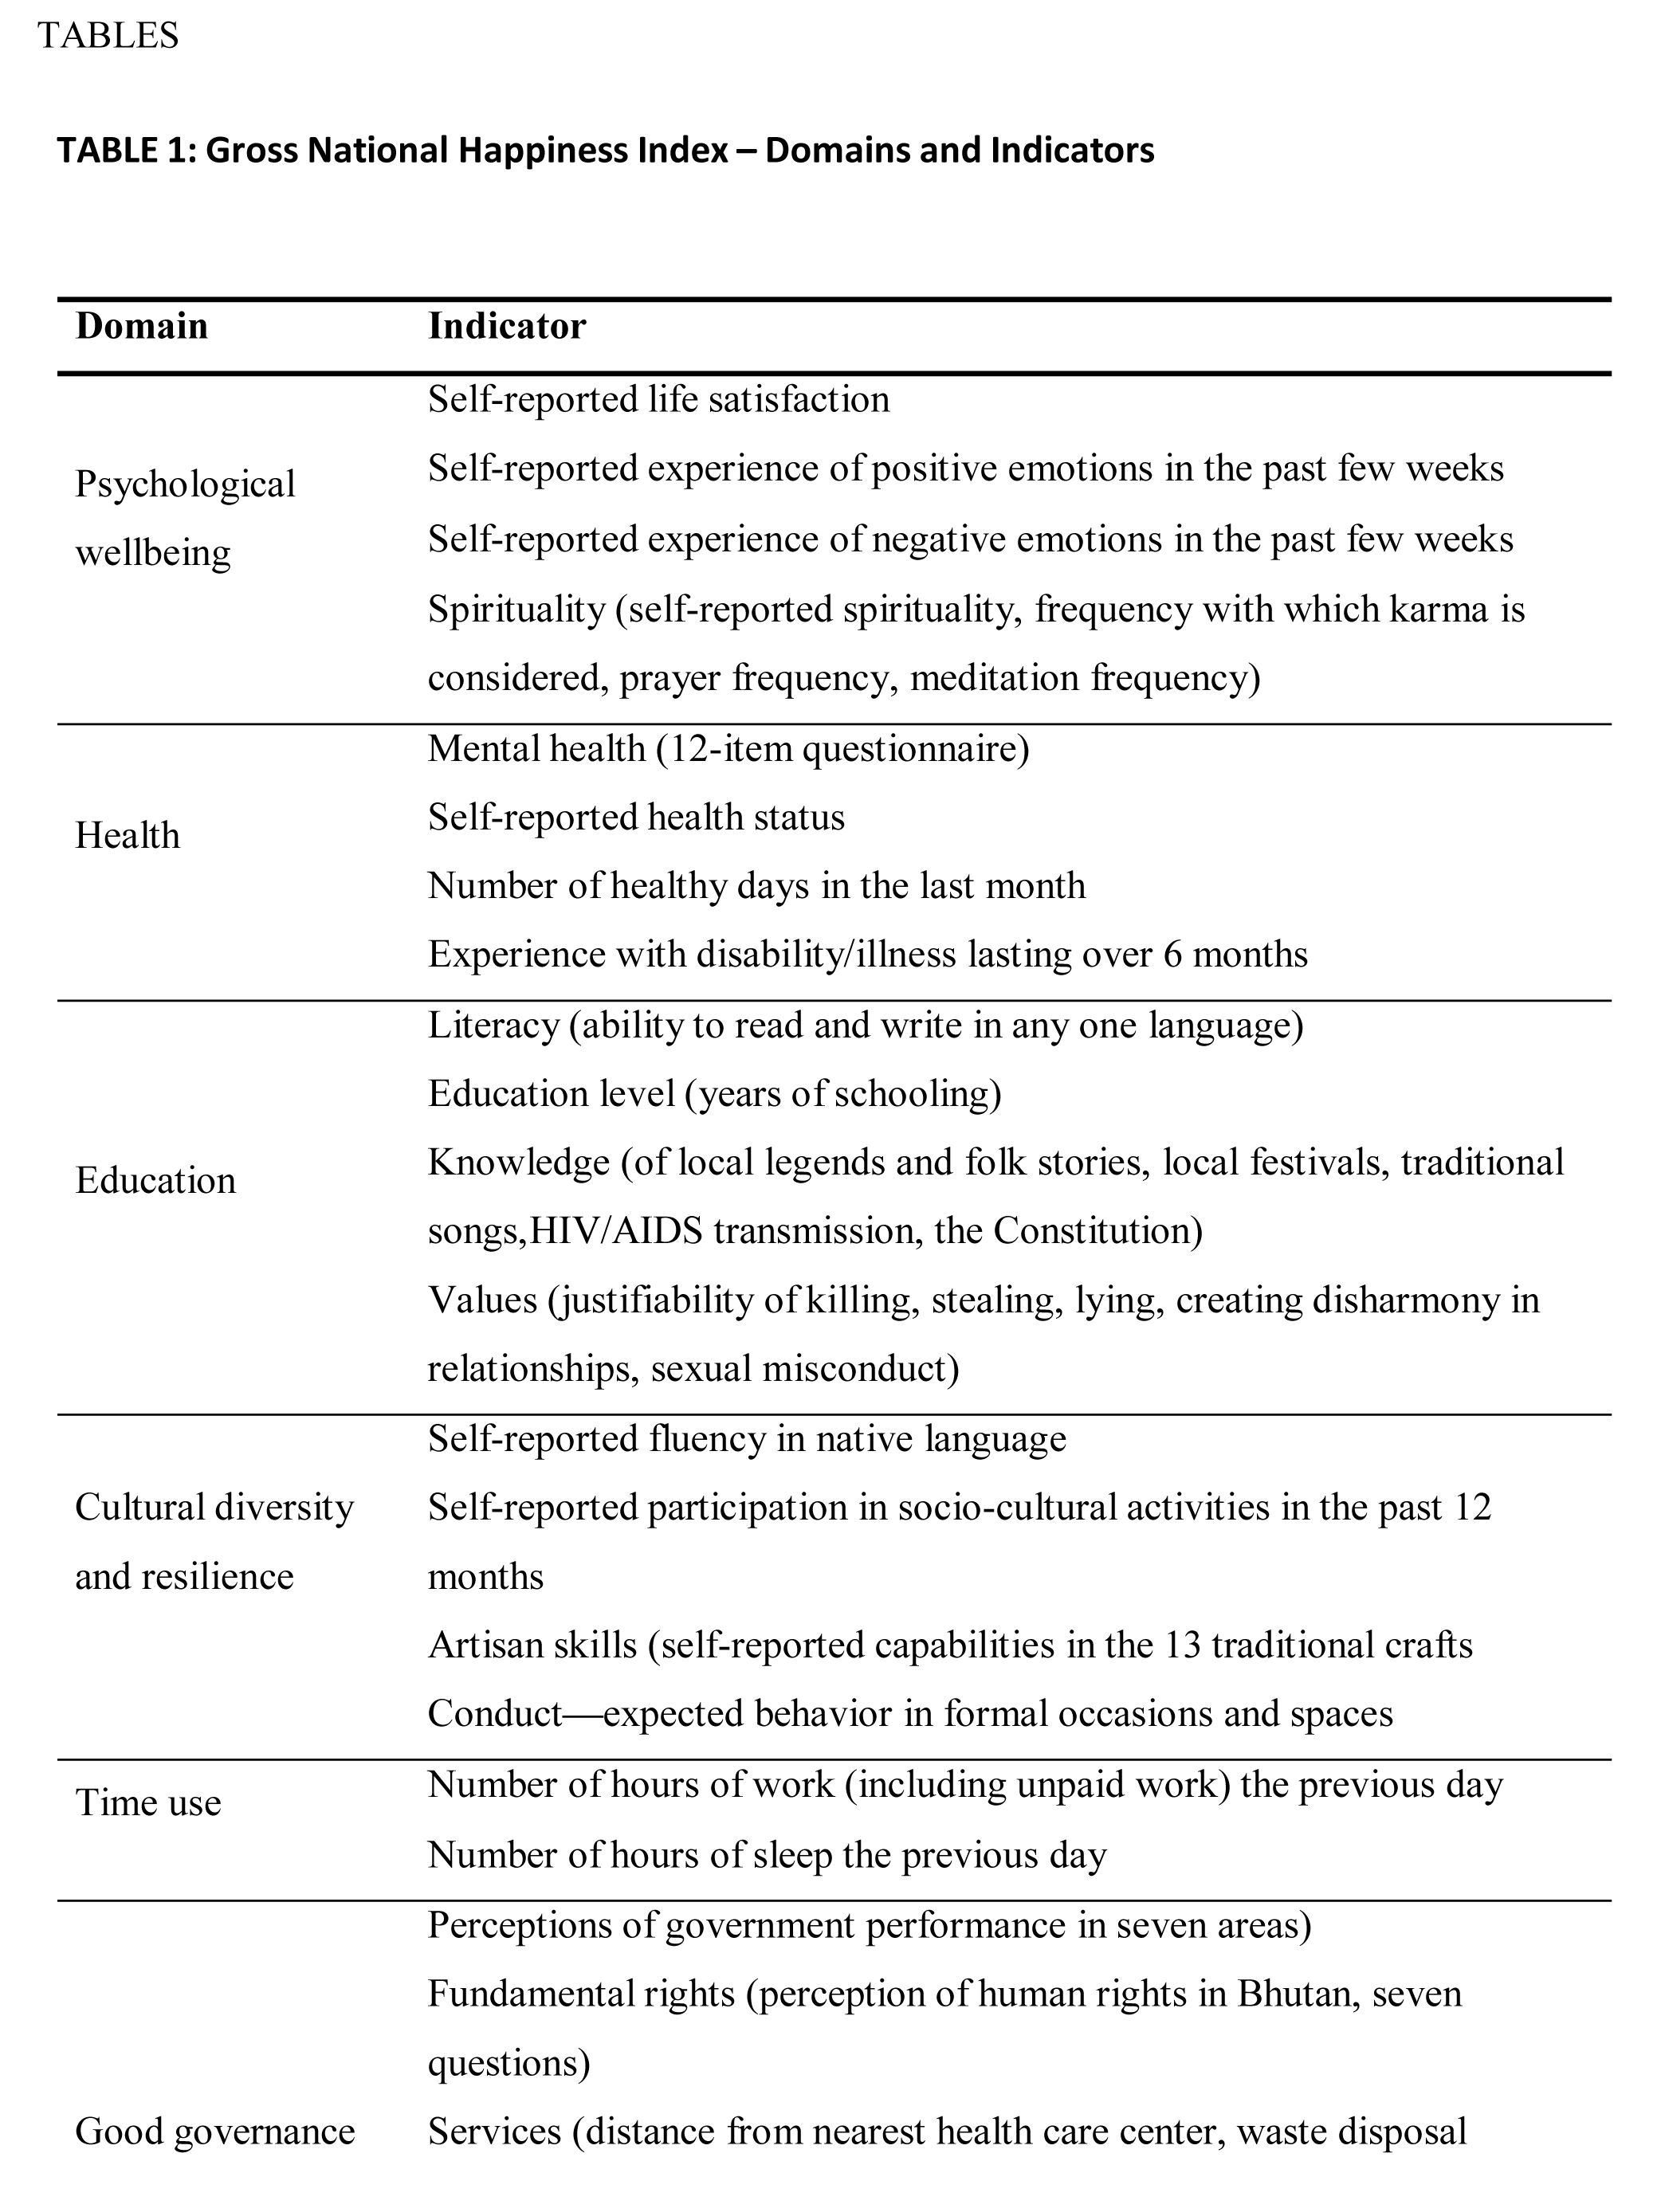
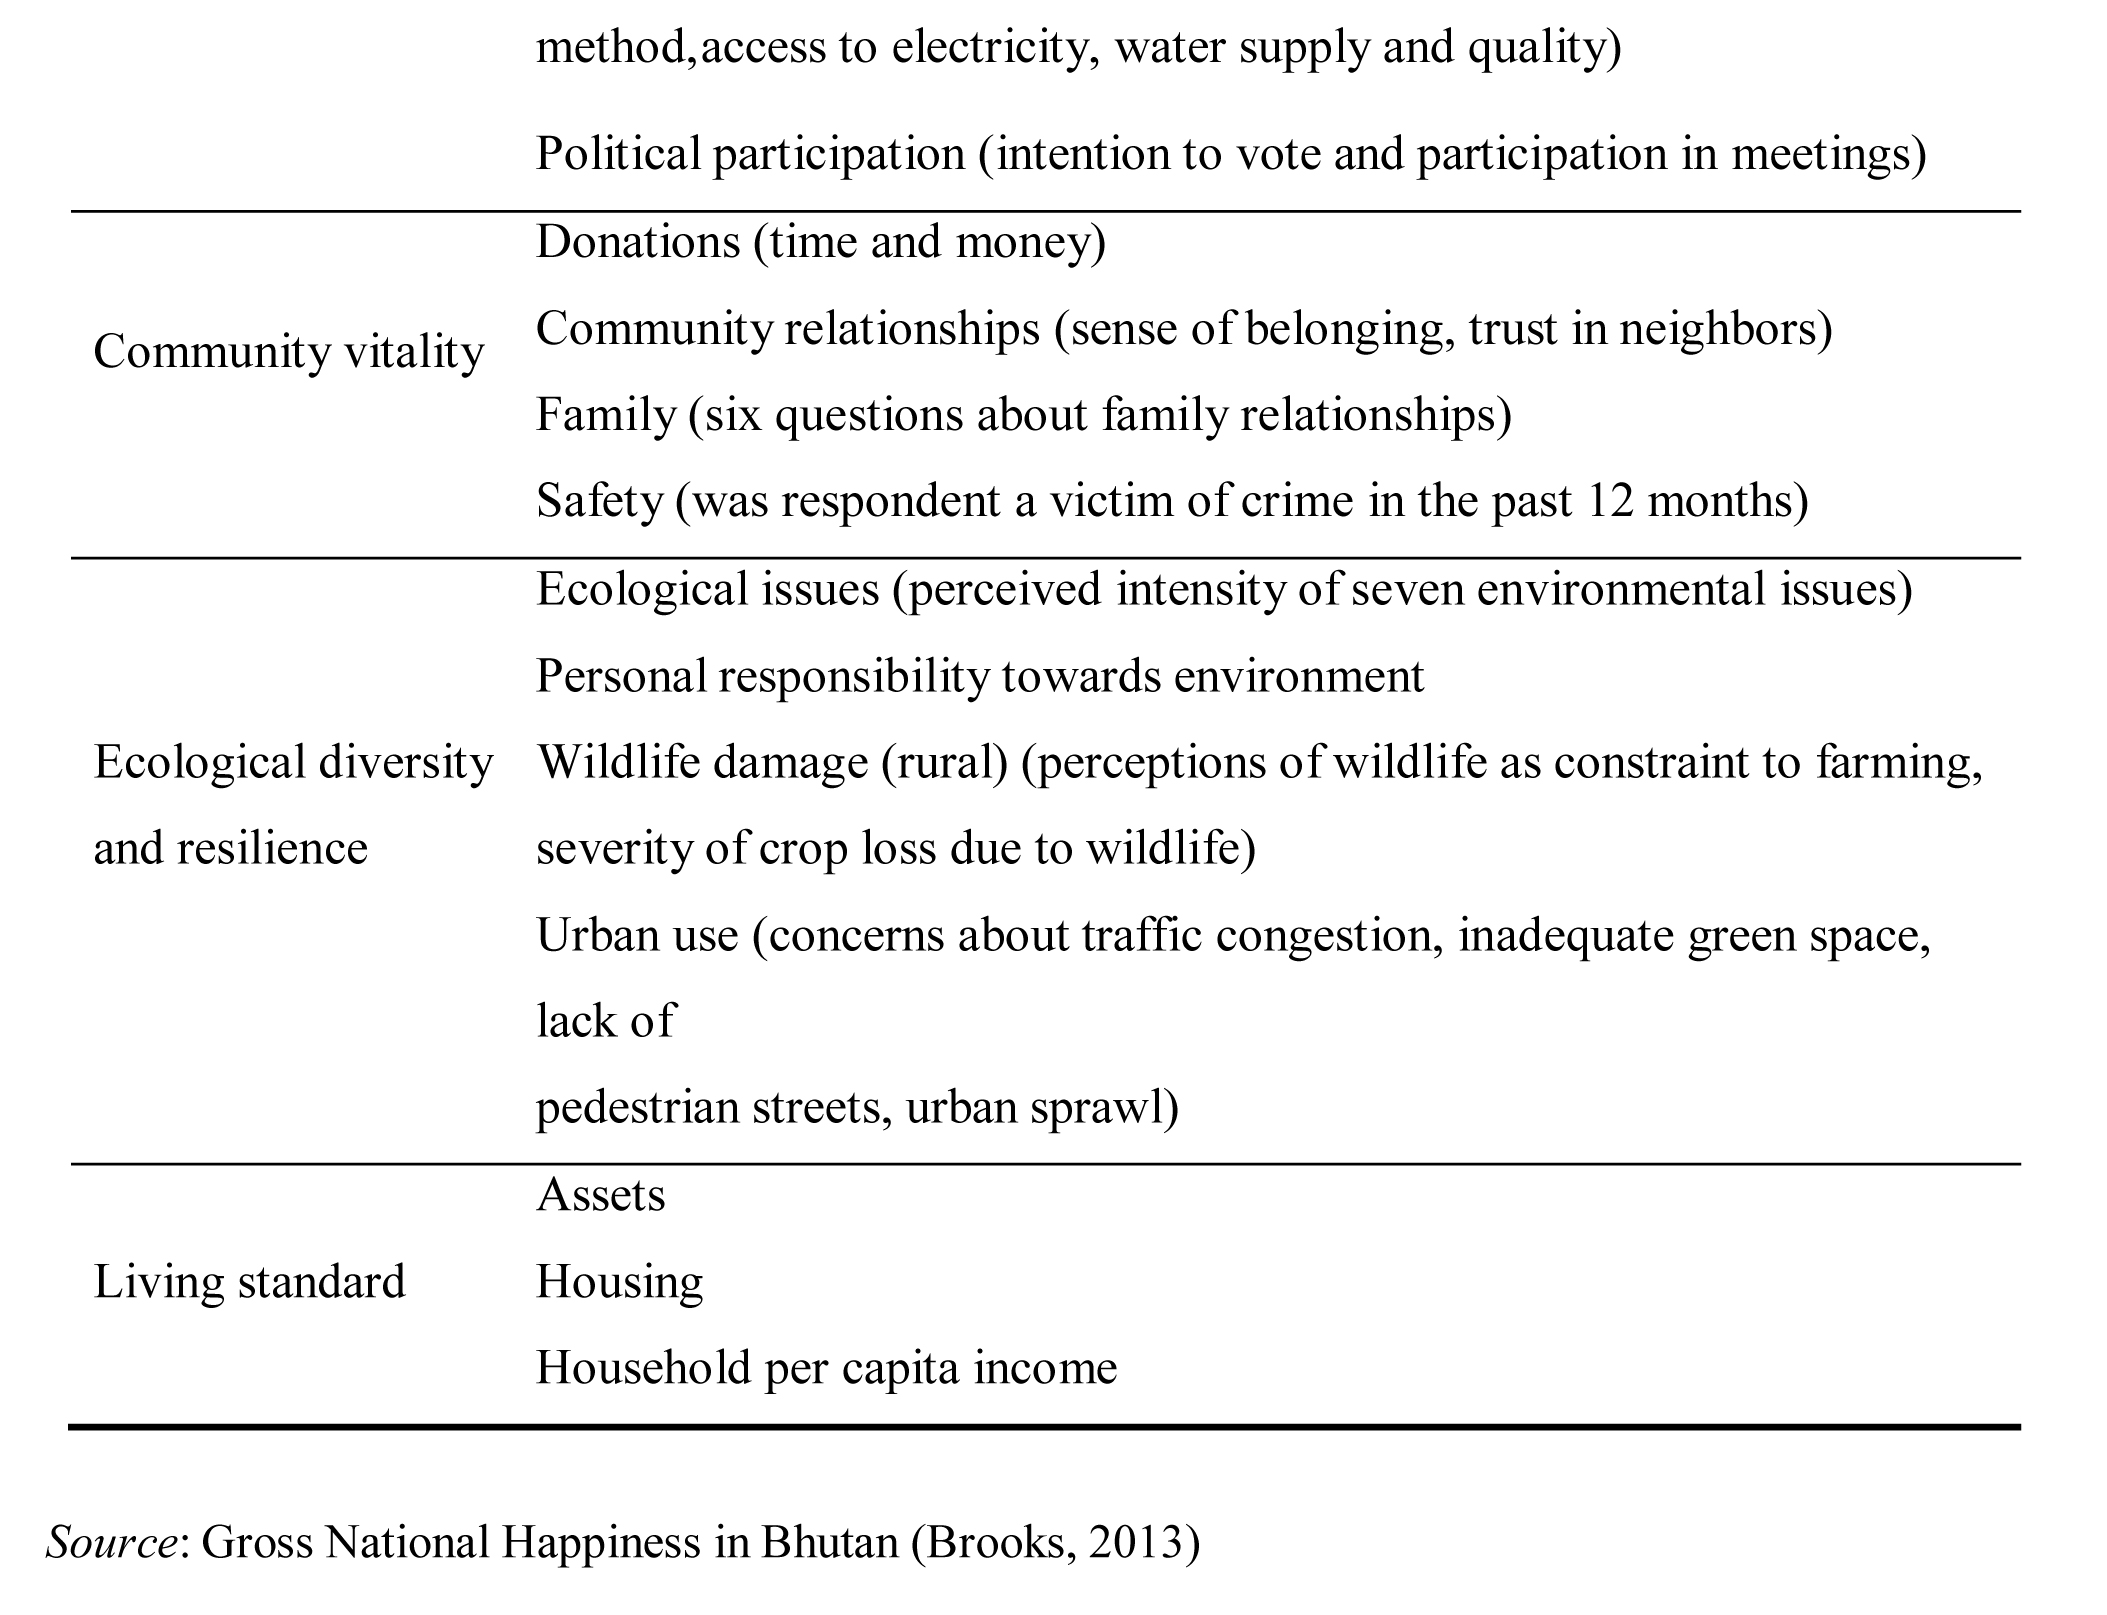
The guiding principles of the Gross National Happiness Index strives to make it holistic (include material, physical, social, and spiritual aspects of life), balanced (balanced progress across all domains), collective (all-encompassing), sustainable (ensuring wellbeing for future generations), and equitable (reasonable level of wellbeing of all). (Ura K. , Alkire, Zangmo, & Wangdi, An Extensive Analysis of GNH Index, 2012) ‘The Middle Path’ of Mahayana Buddhism inspired the four pillars of the GNH philosophy: (i) sustainable and equitable economic development, (ii) conservation of environment, (iii) preservation of culture, and (iv) promotion of good governance. (Rinzin, 2006) Based on these four pillars are the nine domains: (i) psychological wellbeing, (ii) health, (iii) education, (iv) cultural diversity and resilience, (v) time use, (vi) good governance, (vii) community vitality, (viii) ecological diversity and resilience, and
(ix) living standard. These nine domains have 33 indicators which are constructed using 124
variables. Out of the 33 indicators, 25 are objective and eight subjective. The subjective indicators are: satisfaction, positive and negative emotions, spirituality (psychological wellbeing), self- reported health (health), government performance, fundamental rights (good governance), responsibility towards the environment, and perceptions of ecological issues (ecological diversity and resilience). (Ura K. , Alkire, Zangmo, & Wangdi, An Extensive Analysis of GNH Index, 2012) The indicators were selected based on (a) normative values derived from official documents, (b) their statistical properties, (c) objective and subjective categorization, (d) their relevance to government’s development policy, and (e) on the simplicity of their interpretation. (Ura, Alkire, & Zangmo, 2011) (Table 1 about here).
CALCULATING THE GNH INDEX
The 124 variables make the 33 indicators that comprise the nine domains. While all the domains are weighted equal, the variables are weighted differently; subjective variables are weighted lightly compared to the objective ones. The 33 indicators are aggregated using a variation of the Alkire-Foster Method. (Ura, Alkire, & Zangmo, Gross National Happiness and the GNH Index, 2012) The Alkire-Foster method and its family of measures is protected by copyright by the University of Oxford and was developed at the Oxford Poverty and Human Development Initiative (OPHI), an economic research and policy centre within the Oxford Department of International Development. The OPHI was established in 2007 and is led by Sabina Alkire. (The Oxford Poverty and Human Development Initiative, 2007)
The GNH is measured in three dimensions: breadth, depth, and equality. These three dimensions are calculated as one minus an appropriate measure of insufficiency. The multidimensional measures of insufficiency, M0, M1, and M2, developed by Sabina Alkire and James Foster of the University of Oxford (Alkire & Foster, Counting and Multidimensional Poverty Measurement, 2008), are based on Amartya Sen’s ‘capabilities approach’ (Sen, 1999) which was later refined by Martha Nussbaum (Nussbaum, 2011), and yield the corresponding three measures of GNH as follows:
GNH0 = 1 – M0 = 1 – HA (1)
GNH1 = 1 – M1 = 1 – HAG (2)
GNH2 = 1 – M2 = 1 – HAS GNH1 = 1 (3)
Equations (1), (2), and (3) measure, respectively, breadth of sufficiency, depth of sufficiency, and the inequality in achieving sufficiency. Where, H = headcount which equals the percentage of households that do not achieve sufficiency, A= average proportion of dimensions in which households do not achieve sufficiency, G = average shortfall from sufficiency, and S = square of average shortfall from sufficiency. (Alkire, Bhutan: GNH Index 2008, 2008)
The aggregation and calculation of final GNH numbers, second stage of the process, follows the calculation of shortfall based on a set of pre-decided cut-off, the first stage, determined variously using relevant international standards (e.g., hours of work) or national ones (e.g., sufficient level of income threshold was set as 1.5 times the income poverty line for Bhutan). Indicators for which no appropriate guide is available, cut-offs is decided normatively based on Bhutan’s socio-religious milieu. Focus group discussions help unravel dimensions for this judgment. A second threshold is applied measuring for happiness – a person is identified as happy if she achieves sufficiency in 70% of the domains. (Ura, Alkire, & Zangmo, A Short Guide to Gross National Happiness Index, 2012)
INTERPRETING THE GNH INDEX
Once the final measures are calculated, the scores are used to divide the population into two sets of people: (a) those who are happy – extensively and deeply, and (b) those who are not yet happy (unhappy and narrowly unhappy). The next step is to identify the domains in which the second group of people lack sufficiency. This disaggregation can be done district, sub-district and village-wise as well as gender, age group, and occupation-wise. The second group of people are policy priority and all efforts by the government, institutions, communities, and households and individuals must concentrate on augmenting the total happiness of these people. The Bhutanese assert that once sufficiency is reached, any further improvement in the said score does not matter
– the Middle Path philosophy – and thus, the focus is on only the second group of not-yet-happy people. All policy actions should result in either of the two desired outcomes: they should increase the percentage of people who are happy or they should increase the percentage of domains in which the not-yet-happy people achieve sufficiency.
EVALUATION OF THE GNH INDEX
The GNH Index of Bhutan was preceded by about five years by the Gross National Wellbeing/Happiness Index (GNW/GNH) developed by the International Institute of Management in the United States. This happiness index comprises seven dimensions of wellbeing: (i) mental and emotional, (ii) physical and health, (iii) work and income, (iv) social relations, (v) economic and retirement, (vi) political and government, and (vii) living environment. Apart from a 11 point Likert-type scale measuring overall satisfaction on these seven dimensions, answers to four qualitative open-ended questions are also included in calculating the overall value of the index. (International Institute of Management, 2018)
A similar approach towards measuring happiness/wellbeing was proposed in early 2010 by the Commission on the Measurement of Economic Performance and Social Progress (CMEPSP), constituted by the then President of the French Republic, Nicholas Sarkozy. The Commission, headed by Joseph Stiglitz, advised by Amartya Sen, and coordinated by Jean-Paul Fitoussi, developed a multidimensional approach toward measuring wellbeing encompassing: (i) material living standard (income, consumption, and wealth), (ii) health, (iii) education, (iv) personal activities including work, (v) political voice and governance, (vi) social connections and relationships, (vii) environment (present and future conditions), and (viii) insecurity (economic and as well as physical). (Stiglitz, Sen, & Fitoussi, 2010)
The two indices mentioned above, can be considered to be the closest in approach to the Gross National Happiness Index of Bhutan, yet the three differ in more than one substantial ways, and therein lies the uniqueness and appeal of the GNH of Bhutan. Looking at the list of dimensions, aspects, and domains of the three – GNW, Stiglitz-Sen-Fitoussi Index, and GNH – the biggest difference stands out. The GNH is the only one that includes spirituality and specific aspects of it
– meditation, prayer, etc. – in its construct of happiness.
Second major advancement of GNH over others is that it goes beyond mere terms and conditions of employment and enquires into its content by emphasising creativity and richness as evidenced by its taking into account the number of traditional skills that an individual acquires.
But, these very two aspects – although unique – become major drawbacks of the index, too. Including spirituality in the quest makes the index non-secular in nature thus diminishing its applicability. Further curtailing its reach is the fact that spirituality envisaged in the index is of a specific variety, Drukpa Lineage of Vajrayana Buddhism. Similarly, the aspect of richness and
creativity measured by the acquisition of the traditional artisan skills are very specific to the culture of Bhutan. These two features make GNH a very localized, completely custom-made index applicable only for the Kingdom of Bhutan. Lack of universal applicability is its biggest lacuna. Attempts at adaptation by other countries will be possible only with huge modifications that will change the fundamental nature of the concept and the subsequently calculated index.
THE LEGATUM PROSPERITY INDEX
First published in 2007, London-based Legatum Institute has now been publishing the annual Prosperity Index for thirteen years, the latest being the Legatum Prosperity Index 2019. The Legatum Institute is part of the Legatum Foundation which is a division of the investment firm Legatum Group.
The Index is an agglomeration of 294 variables measuring 65 elements under 12 pillars constituting 3 domains. This revised version of the Index, published in 2019, improves upon its earlier methodology that measured 85 elements (see Figure 1). The review and refinement of the earlier methodology, conducted after twelve years of continuous publication, took almost a year to complete and involved consultation with over 100 experts from around the world.
The Index seems to be inspired by Sen and Nussbaum’s capabilities approach as it recognizes prosperity to be a multidimensional concept going beyond the concept of accumulating wealth to creating an environment where every individual is able to attain to his full potential. (Stroud, 2019)
COMPONENTS OF THE LPI
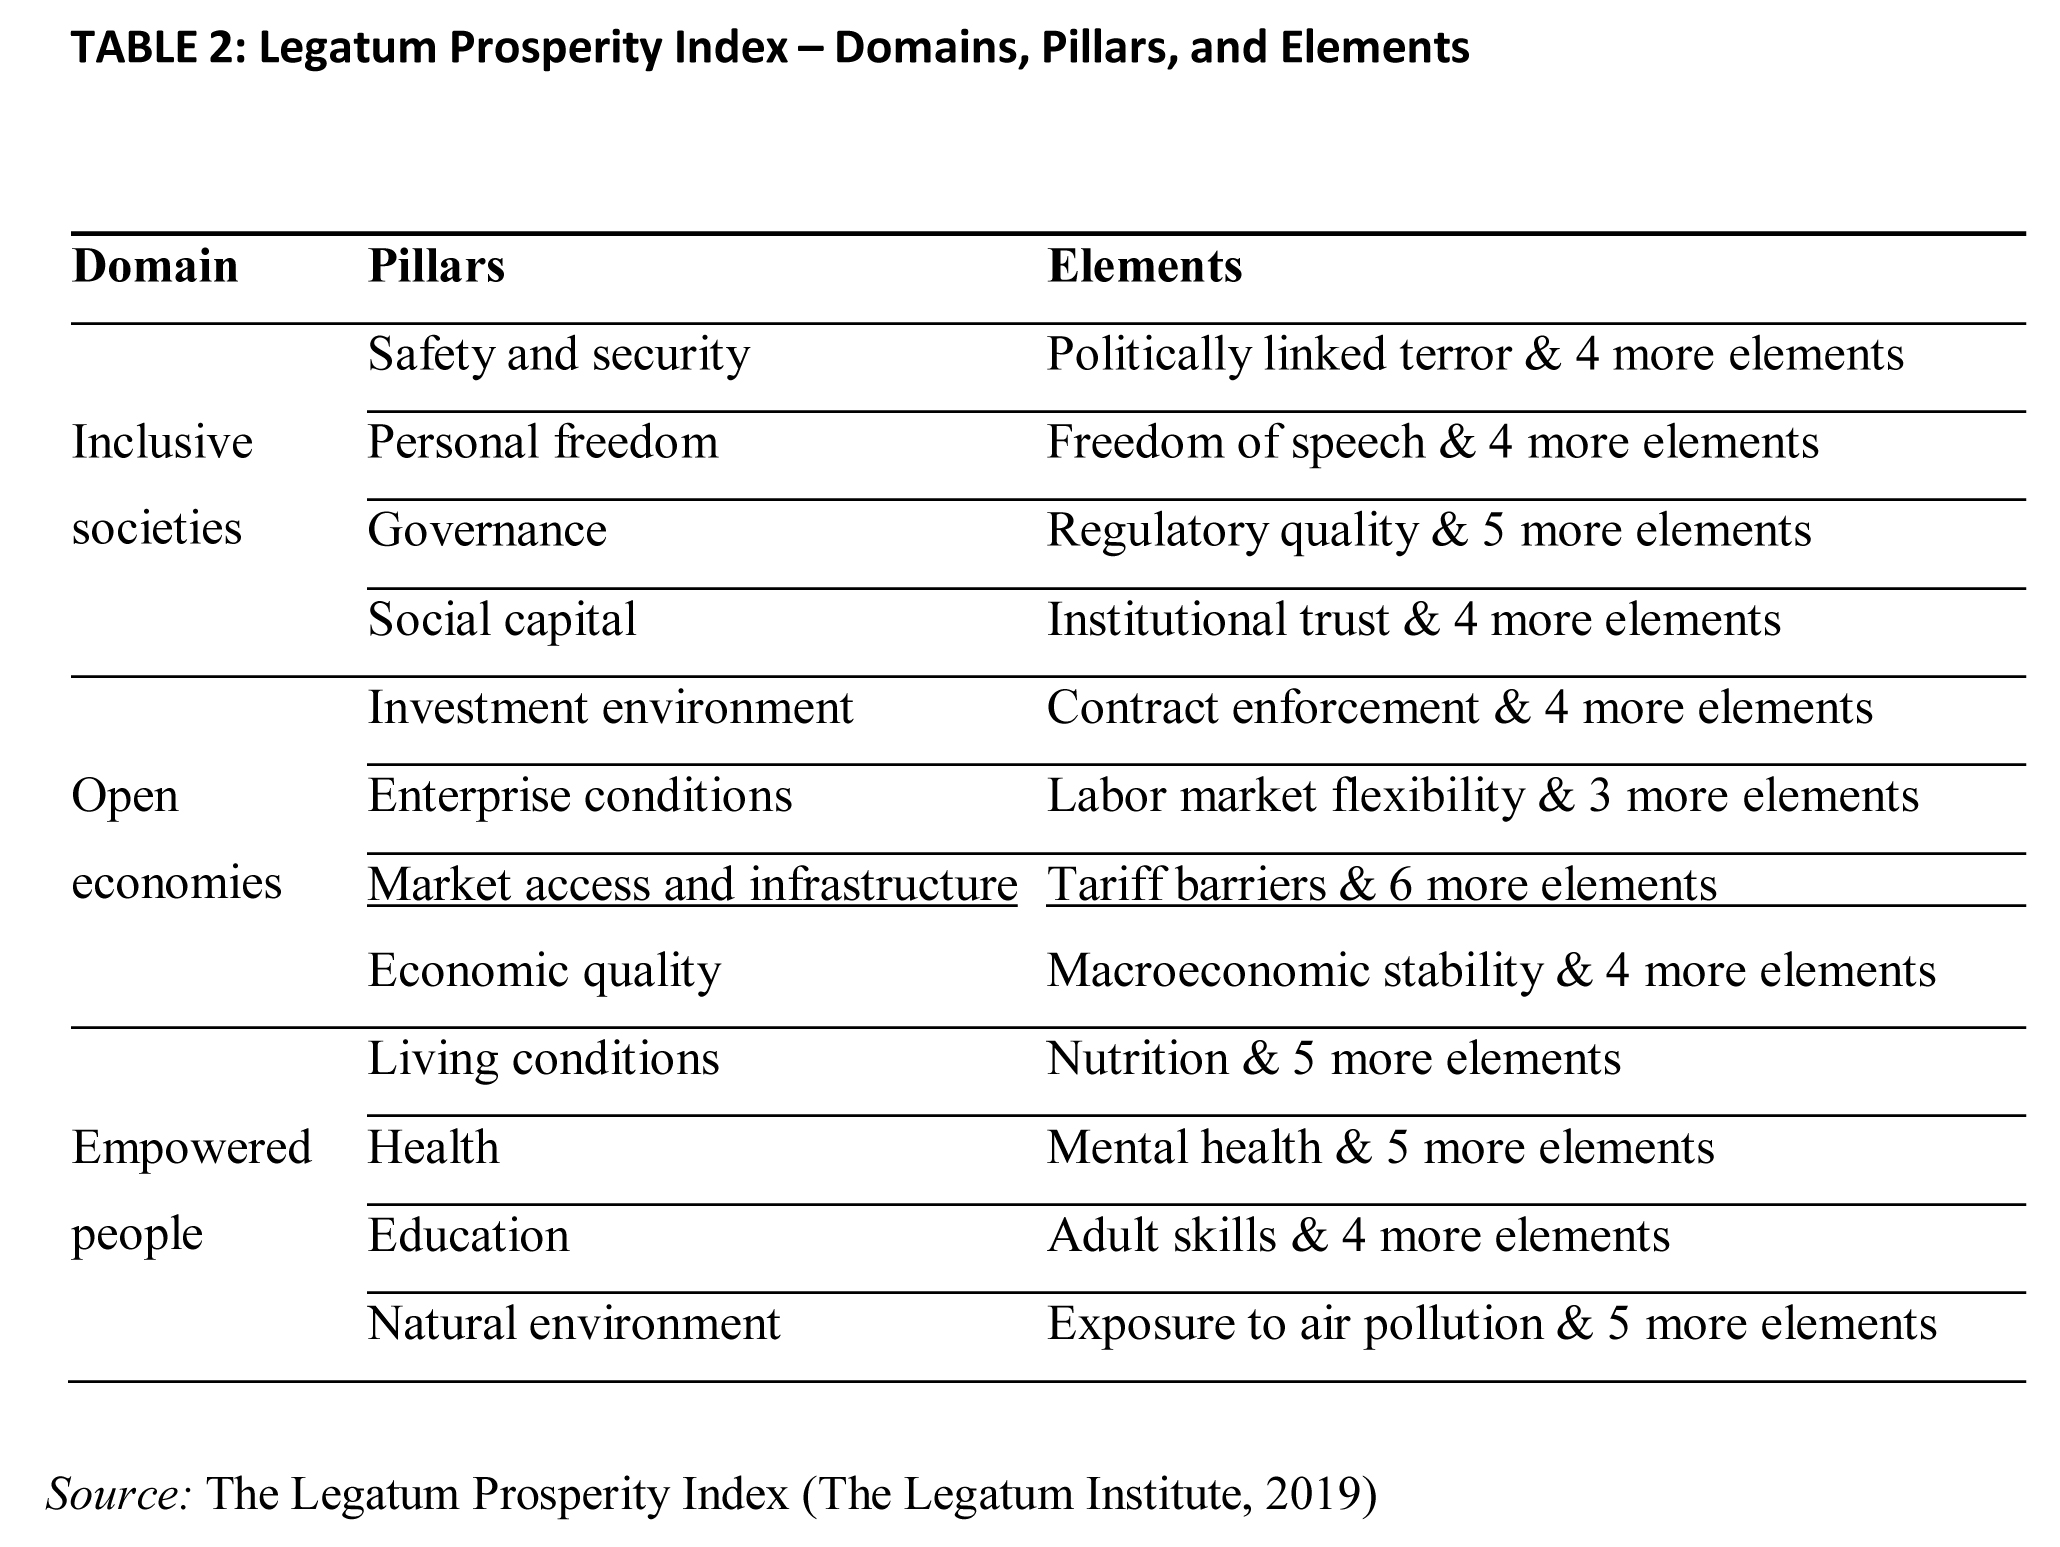
The Index decomposes prosperity into three broad domains: (i) inclusive societies, (ii) open economies, and (iii) empowered people. Through 95 indicators encapsulated within 21 elements, the first domain tries to assess social relationship structures through their potential for promoting cohesion, protecting personal freedom, and striving for collective development. The second domain uses 98 indicators to assay degree of openness of an economy encompassed within 21 elements that profile competitiveness, innovation, entrepreneurial spirit and access to markets, etc. The third domain tries to ascertain the existence of conditions and environment that help an individual reach his full potential through 101 indicators across 23 elements examining physical
quality of life including living conditions, health, and environment. (The Legatum Institute, 2019) (Table 2 about here)
CALCULATING THE LPI
The three domains of the LPI straddle twelve equally weighted pillars and not only intra- correlate but also inter-correlate with pillars of other domains. Elements describing the pillars are selected based on how well they define the core concepts of their respective domains and are constructed in such a way that they cover comprehensively all aspects of the pillar. This is ensured by assessing elements for being causal factor for both wealth and wellbeing through their correlation with productivity and Cantril’s Ladder. The elements are then examined for academic backing, conceptual clarity, and ease of translation into terms of actionable policy items. Some additional considerations are also made before the final selection – elements should be such that they capture change over time and should be available for the widest possible number of countries. The final tally of elements selected using the criterion, in the original index (published in the year 2007), were 89 and encompassed nine pillars. The revised and improved Index (November, 2019) comprises 65 elements that are measured using 294 variables.
The indicators vary in terms of the scale of measurement, e.g., ordinal and ratio, and as such need to be normalized before being aggregated. After applying log-normal transformation where applicable, the indicator values are normalized using Distance-to-Frontier (DTF) approach. After defining the best case/worst case frontiers for each of the individual indicators, the DTF normalized score is calculated as:
𝑥𝑗 − 𝑤𝑜𝑟𝑠𝑡 𝑐𝑎𝑠𝑒
𝑖
𝑏𝑒𝑠𝑡 𝑐𝑎𝑠𝑒 − 𝑤𝑜𝑟𝑠𝑡 𝑐𝑎𝑠𝑒 (4)
The normalized indicator scores are then assigned weights and aggregated to form an element score. Next, the element scores are assigned weights and aggregated form a pillar score. And, finally the pillar scores are weighted (all pillars are weighted equally) and aggregated to arrive at the final prosperity index of a country. At each stage, the weights are assigned based on the relevance, significance, and robustness of the measure. For individual indicators, weights are typically assigned as either 0.5, 1.0, 1.5, or 2.0. Element scores are calculated as follows:
∑𝑛 𝑤𝑗 ∗ 𝑖𝑛𝑑𝑗
𝑗=1
𝐸 = 100 ∗ ∑𝑛 𝑤
𝑗=1 𝑗 (5)
Where, E = element score, indj = DTF normalized indicator score, and wj = indicator weights, with j = 1, …, n. Once the element scores are calculated, pillar scores are aggregated using the formula:
∑𝑚 𝑘𝑗 ∗ 𝐸𝑗
𝑗=1
𝑃 = ∑𝑚 𝑘
𝑗=1 𝑗 (6)
Where, P = pillar score, Ej = element score, kj = weights for j = 1, …, n. The domain scores are simply the arithmetic average of the four pillar scores within each of the respective domains. The final step is the calculation of a country’s prosperity index. Since, all pillars are weighted equally, the final index is given by:
1 12
𝑃𝑟𝑜𝑠𝑝 = 12 ∑ 𝑃𝑗
𝑗=1 (7)
Where, Pj = pillar scores for j = 1, …, n. (The Legatum Institute, 2019)
INTERPRETING THE LPI
Since standardized scores are used for aggregation, the overall index as well as domain and indicator scores can be easily used for cross-country comparisons. At the individual country level, domain-wise interpretation can be made and indicator-wise progress tracked. Such, disaggregated tracking can help in policy formulation and framing of actionable guidelines. The Legatum Institute makes available the entire database, all 294 indicator values for all the years the Index has been published, making it easy for researchers, academicians, and policy makers to alter the weights assigned and devise their own custom-purpose index.
EVALUATION OF THE LEGATUM PROSPERITY INDEX
After a thorough revision of the index, the LPI now includes a more robust set of elements measured through a wide array of indicators making it one of the most comprehensive measure of a country’s prosperity. Inclusion of a very large number of indicators (294 indicators in the 2019 report) does imply that many of the indicators have significant correlations with each other. While significant correlations among intra-element indicators and intra-pillar elements is expected as the pillars and elements are constructs which are reflectively measured by the indicators, the presence
of significant inter-domain correlations does raise the question of redundancy. (Otoiua, Titanb, & Dumitrescuc, 2014) The creators of the Index assert that inter-correlations rather than being an unavoidable result of including a large number of indicators is actually a deliberate choice of design. The argument forwarded is that all dimensions are equally important aspects of prosperity and thus are intertwined with each other implying that a change in any one of the elements – reported through changes in indicators measuring it – can and does affect elements in more than one pillar and domain and, therefore, each pillar must be examined in the broader setting of the overall index. (The Legatum Institute, 2019)
Inclusion of a large number of indicators must also be weighed against the fact that the Sarkozy team, Stiglitz-Sen-Fitoussi, in their scholarly and detailed report failed to put up variables that can be meaningfully measured. The report and its recommendations have been criticized for not only being apparently politically motivated but also to indulge in speculative valuation of certain aspects of wellbeing. In contrast, the Legatum Prosperity Index includes only variables that have already been collected for a long period of time and are attested to be robust, standardized, and publicly available. The LPI makes use of over 80 different data sources to construct the index. (Bate, 2009)
SUSTAINABLE DEVELOPMENT GOALS
In September 2015 the United Nations General Assembly unanimously adopted “Transforming Our World: The 2030 Agenda for Sustainable Development”. At the core of this beyond-2015 agenda lies the Sustainable Development Goals (SDGs) – a set of seventeen objectives to be achieved by all the member states by the year 2030. These goals build on the earlier Millennium Development Goals (MDGs) that expired in 2015, hence the moniker ‘beyond- 2015’ for the SDGs. But, SDGs have a genesis that stems from the UN Conference on Sustainable Development in Rio de Janeiro, Brazil, (nick-named Rio+20) held in 2012, or even earlier, to the UN Conference on the Human Environment in Stockholm, Sweden, held in 1972.
Parallel to these events, the UN Millennium Summit happened in September 2000 which led to the adoption of the UN Millennium Declaration subsequent to which, the UN devised a set of eight time-limited targets known as the Millennium Development Goals, to be achieved by the member states by the year 2015. The eight MDGs – eradicate extreme poverty and hunger, achieve universal primary education, promote gender equality and empower women, reduce child mortality,
improve maternal health, combat HIV/AIDS, malaria and other diseases, ensure environmental sustainability, and foster global partnership for development – lacked universal appeal as they were mostly focused on problems and shortcomings of the developing world and aimed, mostly, to be financed through aids from the industrialized countries. These targets expired in 2015 with mixed results achieved by the signatories. Nevertheless, the greatest learning of the exercise was that globally coordinated efforts could be organized to work towards common goals. What sets the SDGs apart for the MDGs is the very fact that the former is not limited to the concerns of the developing countries only; they are equally applicable to all the countries and are set as desired goals to be achieved by all member nations. (United Nations, 2020)
COMPONENTS OF THE SDGS
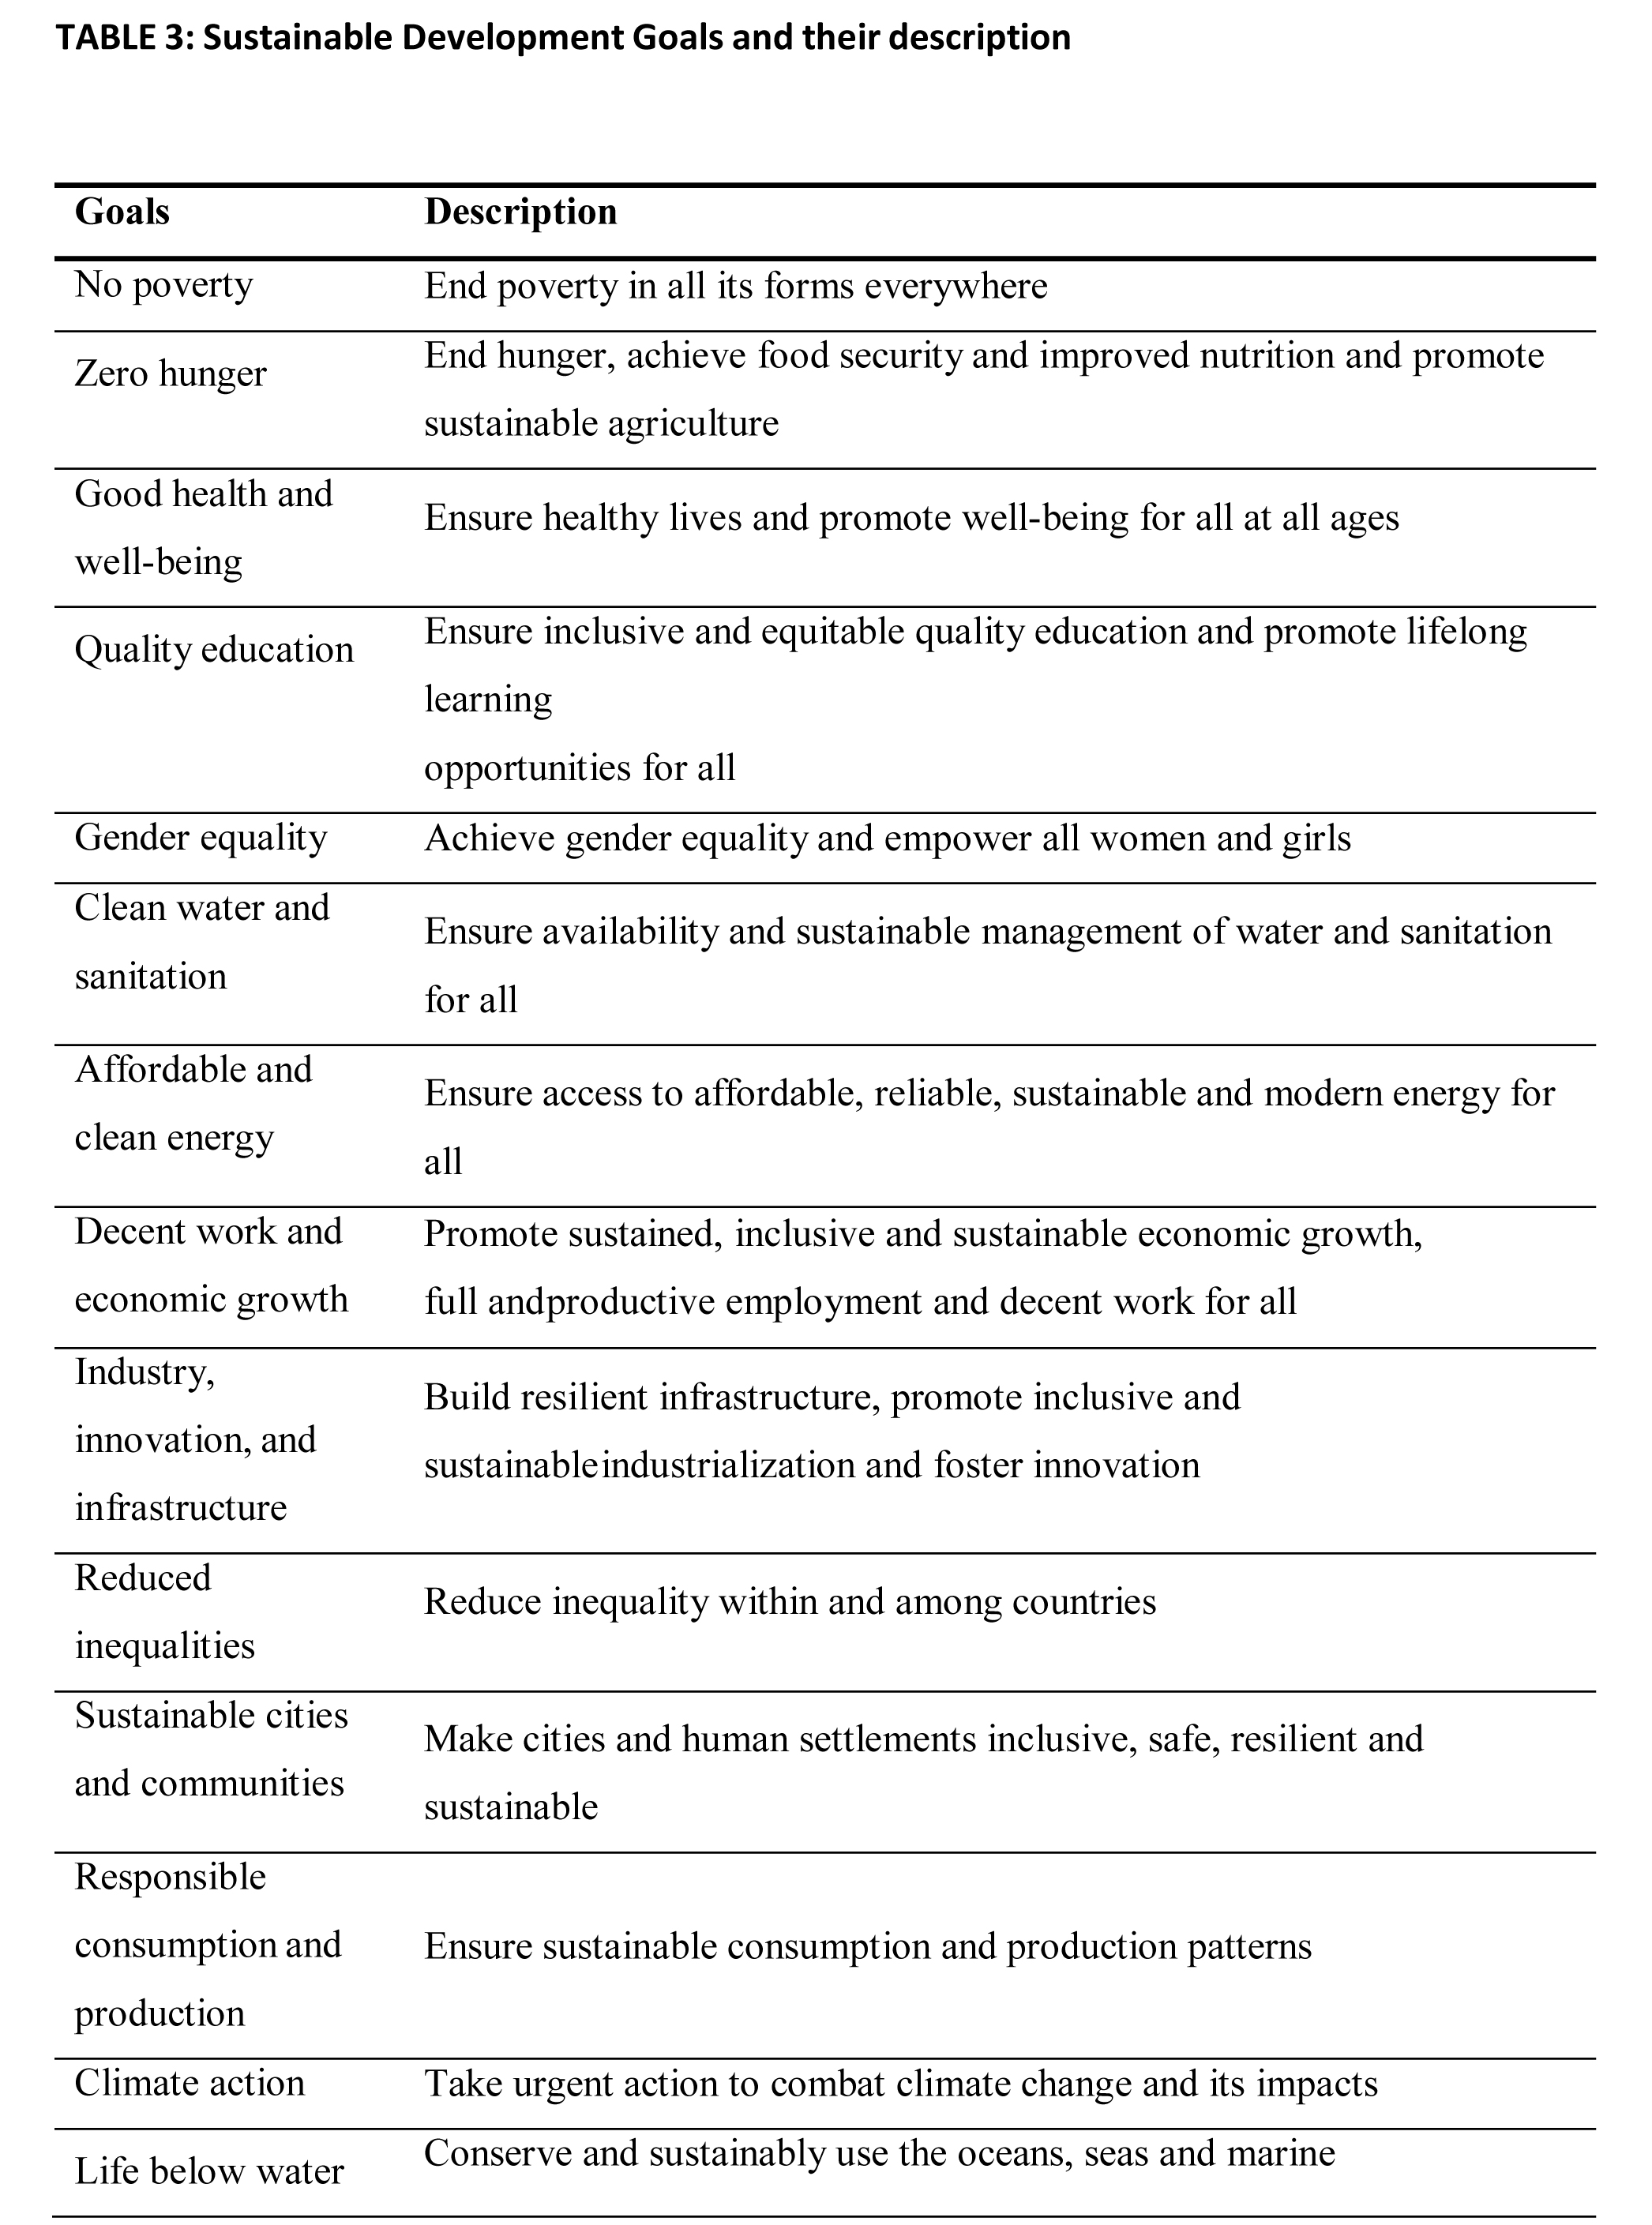
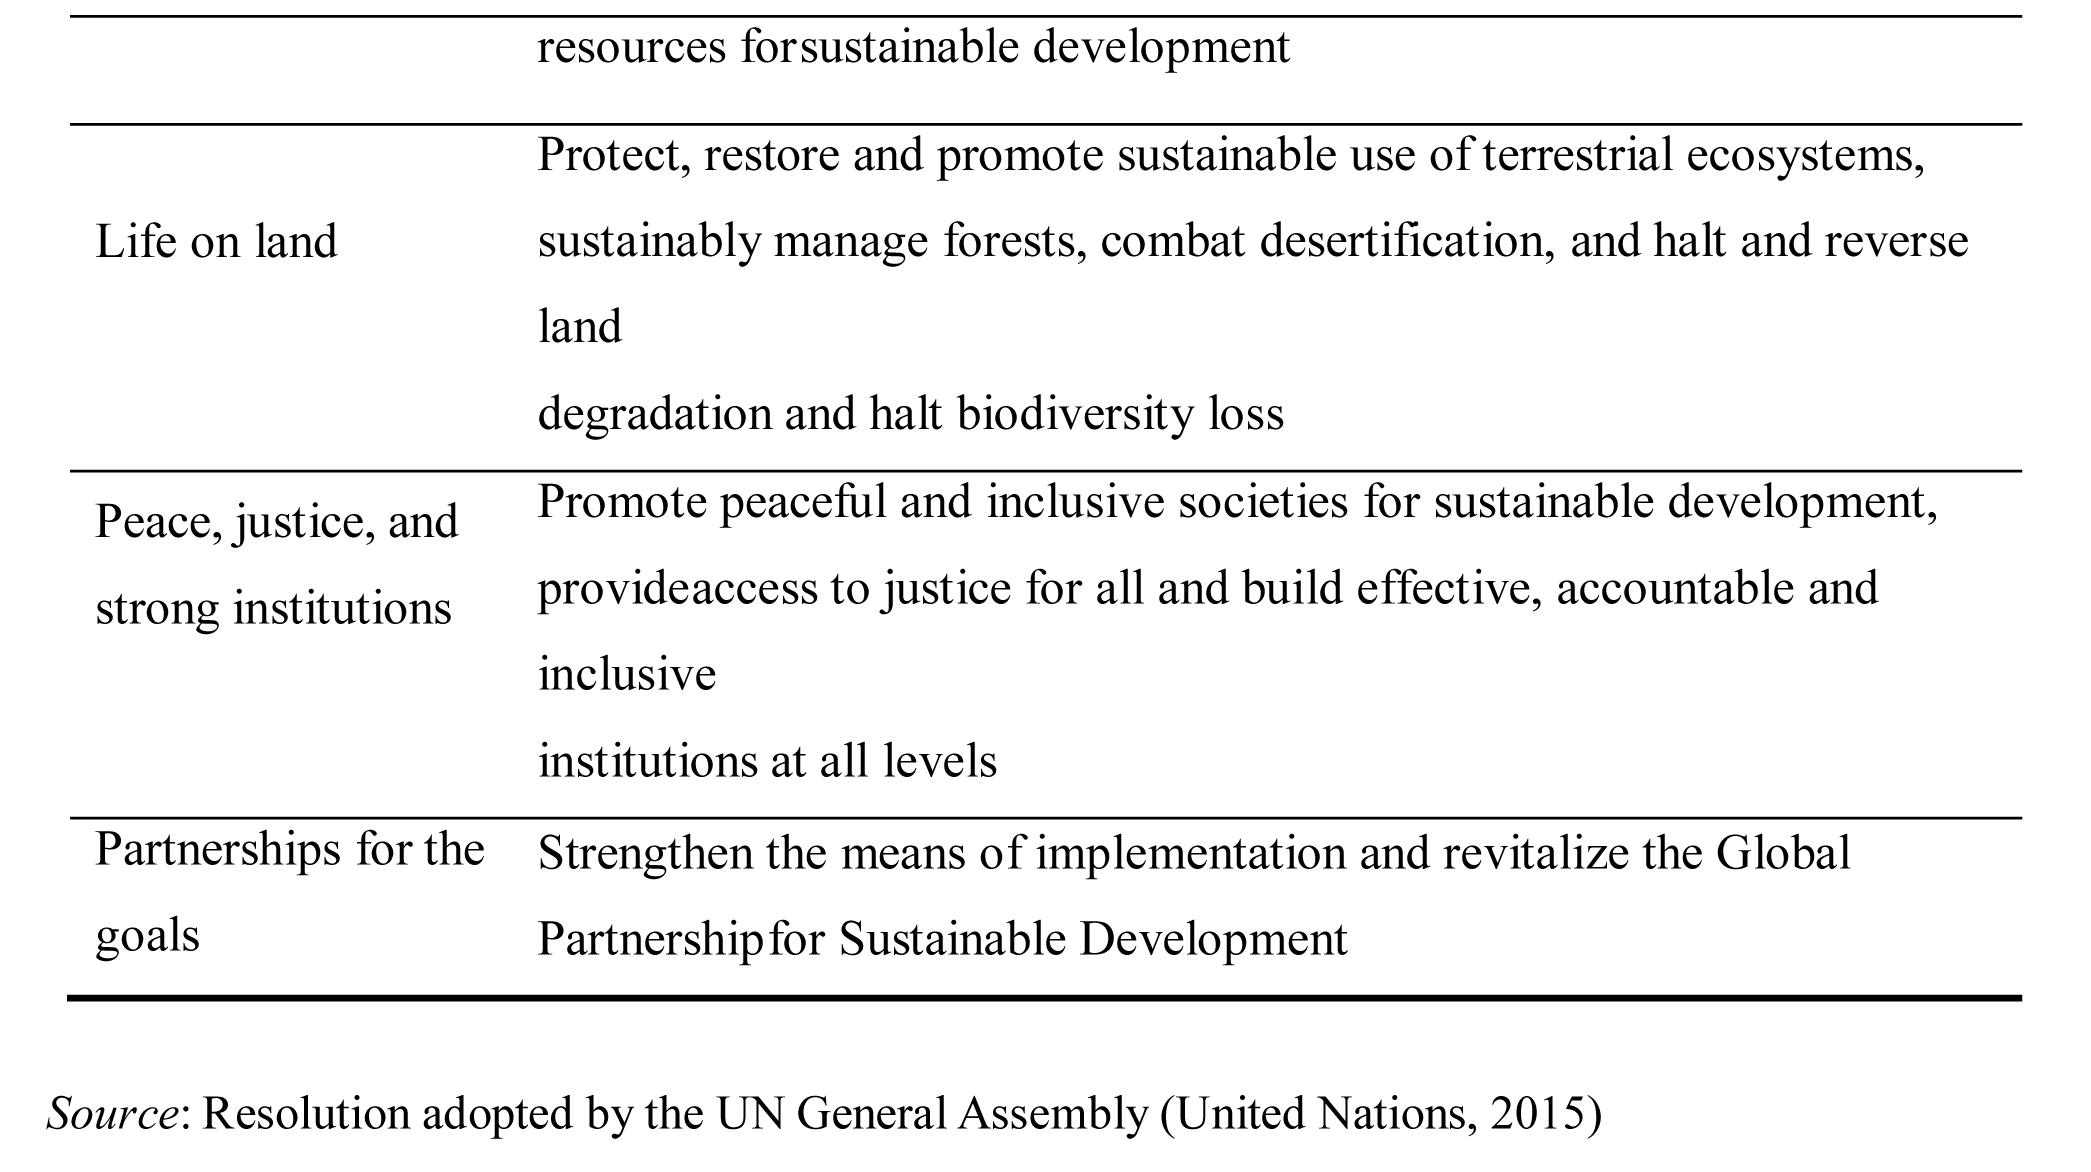
Much like the GNH of Bhutan, the SDG agenda relies heavily on participation by all stakeholders and not just the governments. The seventeen Sustainable Development Goals are: (i) no poverty, (ii) zero hunger, (iii) good health and well-being, (iv) quality education, (v) gender equality, (vi) clean water and sanitation, (vii) affordable and clean energy, (viii) decent work and economic growth, (ix) industry, innovation and infrastructure, (x) reduced inequalities, (xi) sustainable cities and communities, (xii) responsible consumption and production, (xiii) climate action, (xiv) life below water, (xvi) peace, justice, and strong institutions, and (xvii) partnership for the goals. (United Nations, 2015) (Table 3 about here)
Although SDGs are not legally binding on the signatory nations (in this case, all 193 member-nations), the understanding is that the countries will take ownership of the goals and create their own framework for achieving the goals. Also, they are expected to assume the responsibility monitoring, follow-up, and review of the progress made under their respective national frameworks.
MEASURING SDG PERFORMANCE
Achievement of the seventeen goals are measured by 169 targets. A comprehensive list of indicators, 232 in all, was developed by the UN Statistical Commission and adopted by the UN General Assembly in July 2017. The indicators are consistently defined across all countries thus facilitating easy inter-country comparison. The indicators are classified into three tiers based on the conceptual and methodological clarity and availability of data. Tier I indicators are clearly
defined and reliable data is readily available and collected regularly; Tier II indicators are well defined but their data are not collected regularly; Tier III indicators are not clearly defined or the methodologies for collecting them established – yet. As of May 2019, there are 104 Tier I, 88 Tier II, and 34 Tier III indicators while six indicators are classified under multiple tiers; almost half of the 169 targets are not quantified. (Independent Group of Scientists appointed by the Secretary- General, 2019)
But, the SDG targets and indicators are not aggregated into an index. The indicator framework resolution document recommends that “Sustainable Development Goal indicators should be disaggregated, where relevant, by income, sex, age, race, ethnicity, migratory status, disability and geographic location, or other characteristics, in accordance with the Fundamental Principles of Official Statistics.” (United Nations, 2017) They are a set of broad policy targets and suggested indicators, both of which are to be adapted by countries according to their specific situations. The ways and means are to be decided upon by the respective countries based on where they stand at the time of adoption of the resolution. Period assessment of the progress towards target achievement as well as review of the strategies adopted is to me made by the countries. The entire assessment and review process is dependent on countries taking ownership of the goals and their achievement. Every country is to have its own framework for achieving the goals, the setting up of which, is entirely up to the individual countries. There is no official index computed by the United Nations, as such. For all practical purposes, countries are free to construct an index, if they want to, and so is whoever else – private citizens, institutions, governments – interested in doing so. This gives freedom to researchers, academicians, etc. to construct an index based on their own assessment of the relative importance – and thereby, the weights – that the individual indicators and targets have. This also gives the freedom to employ different methodologies for aggregating the parameters to arrive at an index. But, any such effort will remain what it is – a private index or at best, for a particular country, its own official index; the UN has no plans to accord recognition to any such efforts.
THE SDSN-BS GLOBAL SDG INDEX
One such effort has the ‘SDG Index and Dashboards’ jointly developed by Sustainable Development Solutions Network (SDSN) and Bertelsmann Stiftung (BS). First released in 2016, this index uses both the official and unofficial metrics (garnered from reputable sources such as
the World Bank, World Health Organization, International Labour Organization, etc.) to measure the distance that a country has travelled toward fully realizing its sustainable development goals.
The SDSN-BS Index takes enormous pains to make it abundantly clear that it is not endorsed by the UN in any way and marks a departure from strictly adhering to the official (UN) set of indicators. Based on its own criteria for selecting indicators, the SDSN-BS Index includes
63 global indicators from the official set and incorporates fourteen additional ones drawn especially for the OECD countries. The criteria used for selecting appropriate metrics is: (i) global relevance and applicability to a broad range of country settings, (ii) statistical adequacy, (iii) timeliness, (iv) data quality, and (v) coverage. The metrics thus selected are rescaled appropriately from 0 (worst performance) to 100 (optimum performance). The metrics are then combined to form indices for individual SDGs and these are then aggregated to arrive at the final SDG Index. In aggregating for both individual SDGs and for the overall SDG Index, the method used is the CES function with equal weights across all components – “weak sustainability” – which translates into using the arithmetic average for aggregation of the metrics. The equation used is:
𝑁𝑖 𝑁𝑖𝑗
𝐼 (𝑁𝑖, 𝑁𝑖𝑗, 𝐼𝑖𝑗𝑘) = ∑ 1 ∑ 1 𝐼
𝑖 𝑁 𝑁 𝑖𝑗𝑘
𝑗=1 𝑖 𝑘=1 𝑖𝑗 (8)
Where Ii = index score for country i, Ni = number of SDGs, Nij = number of indicators of SDG j for country i, and Iijk = score of indicator k under SDG j for country i. (Schmidt-Traub, Kroll, Teksoz, Durand-Delacre, & Sachs, 2017)
The 2020 edition of the index reported data for 166 countries weighing the seventeen goals equally; the country-wise index list is topped by the three Nordic countries: Sweden, Denmark, and Finland. (Sachs, et al., 2020)
SDG INDIA INDEX
India published an official SDG India Index in 2018. The index covered only thirteen of the seventeen SDGs and was based on aggregating 62 metrics. SDGs number 12, 13, 14, and 17 were not included in constructing the index. This followed setting up of a National Indicator Framework that comprised 306 national metrics to be monitored. Out of this larger list, 62 ‘priority indicators’ were selected based on certain criteria, primary one being availability of data for at least 50% of the states and union territories. One major limiting aspect of the indicator selection was that they were all derived from the federal government actions, policies, and projects while
excluding any data generated by the state governments’ policies and projects. (NITI Aayog, 2018) The index was refined and expanded in its next edition published in 2019. It now covers sixteen of the seventeen SDGs; goal 17 is excluded. The expanded report now tracks 100 metrics but aggregates only 95 of them in constructing the index; the left-out metrics, under goal 14, are specific only to nine coastal states. Except for the twelve metrics from among the newly introduced ones, all are taken from the National Indicator Framework; the twelve indicators were identified in consultation with government ministries. (NITI Aayog, 2019) Despite the refinements and expansion, the new index, dubbed SDG India Index 2.0 does not change the index aggregation methodology which is exactly the same as the one used in constructing the SDSN-BS Global SDG Index and, therefore, the interpretation also remains the same. The index represents the current position at which the country is with respect to SDG targets, i.e., the percentage achievement of the SDG goals.
EVALUATION OF THE SDGS
A popular, but erroneous view is that SDGs are direct successors to the Millennium Development Goals (MDGs) that expired in the year 2015. The only succession that SDGs can be attributed is that they became the global agenda once the limelight on the MDGs had faded. SDGs have their own long tradition of genesis and the movement can be traced back to the United Nations Conference on the Human Environment held in Stockholm, Sweden in 1972 although a more direct and formal beginning was mate at the 1992 ‘Earth Summit’ held in Rio de Janeiro, Brazil. The primary point of departure between the MDGs and the SDGs is that while the former was intended only for the developing nations with the developed countries mainly in supportive roles, the latter is truly a global agenda with targets and indicators that have meaning for all the signatory members. The most distinguishing feature of the SDGs is that unlike the MDGs, which were basically drafted by the Office of the UN Secretary-General and a handful of experts, they were developed through extensive multilateral, multiagency, and multi-stakeholder debates and consultations over a period of three years beginning from the 2012 debate on ‘Post-2015 Agenda’.
Extensive consultations and debates ensured that the goals were indeed universal, applicable to not only the poor and developing countries but also meaningful to the rich and developed countries, too. And this led to unanimous adoption of the agenda by all member countries of the United Nations. The SDGs paint a very vast canvas of life, both human and non- human, on planet earth and has the power to reshape it into a better version of itself. For example, Goal 10 – Reduced Inequalities – is equally applicable to the developed and developing economies, both, but call for a deep introspection on the part of the developed nations that possibly would result in reversal of much of the socio-economic policies that they have built their current wealth upon. (Fukuda-Parr, 2016)
Despite near universal adoption, SDGs have been criticized quite vehemently. The earliest criticisms have been complaints about the seemingly large number of goals and targets. Quite often suggestions for indicator selection included “manageability” of the number of indicators. (Hák, ková, & Moldan, 2015) One leading economics periodical called the goals “a distraction”, “unachievable”, and dubbed them as “Stupid Development Goals”. (The Economist, 2015) A manageable number is a subjective concern and there are no scientific ways of determining what that number could be. The number being unwieldly is accentuated by the fact that the goals are not legally binding and, therefore, lack an in-built enforcement mechanism. While this gives countries a space to maneuver and decide upon national priorities to devise short-term strategies appropriate for their specific conditions, it also leaves putting in the effort to do so vulnerable to changes in political dispensation. Absence of any credible enforcement mechanism makes ratification of the SDG Agenda little more than a pious intention.
SDGs have been blamed for pushing the neoliberal economic growth agenda disguised as ‘universal’ goals. Neoliberal policies have been shown to be deeply flawed and at odds against social justice and environmental protection and as the SDGs work within the premise of market- based solutions, they can hardly be expected to be compatible with respecting the environmental constraints. (Adelman, 2018) Evidence is furthered for the alignment of international development agenda with private commercial interests. Seen in the light of the fact that SDGs’ funding strategy envisages enlarged role and active participation of private business, it can be argued that the SDGs would “reinforce the conditions which sustain deprivation of fundamental entitlements to life- sustaining needs for many…” (Weber, 2017)
CONCLUSION
Growing awareness about the inadequacy of GNP/GDP as a measure of progress and the realization that measuring growth does not capture development led to increased research on examining the idea of prosperity. Seminal work by Amartya Sen and Marth Nussbaum was later
developed by many researchers into the idea of prosperity being a multidimensional construct. Many attempts have been made at capturing the multidimensional nature of development and prosperity. Some of the most widely known ‘beyond GDP’ measures are the Human Development Index (HDI), the Genuine Progress Indicator (GPI), Sustainability Index, etc. Two of the most comprehensive measures of the multidimensionality of prosperity (as opposed to deprivation or poverty) are the Gross National Happiness of Bhutan and the Legatum Prosperity Index of the Legatum Institute, UK.
The Gross National Happiness Index has the distinction of being the only measure to be officially adopted by a sovereign government as development policy tool. The wide recognition of GNH is in a major part due to the tremendous amount of publicity and propaganda unleashed by the Royal Government of Bhutan. Indeed, the government of Bhutan insists that the GNH is an integral part of the Bhutanese life and socio-political philosophy. And, it is precisely here that the GNH index fails in becoming a measurement tool of universal applicability. The very construct of GNH index incorporates Bhutanese Buddhist spirituality as an integral part of the measure assessing happiness of the people. The spiritual aspect pervades through more than one domain of nine-domain measure. This makes the index very localized in nature – applicable only to Bhutan. Any attempts at adapting it by other countries will run into major problems. For example, while many countries and societies are theists overall, but the dimensions of their spiritual philosophy and their effect on the societal norms and expectations are all very unique; it will not be easy, if not impossible, to supplant these with the Buddhist spirituality ingrained in the GNH. Moreover, indicators such as prayer and meditation are value judgments that cannot be said to be representative of an entire society, preclusion of atheists being the most pointed omission. Thus, despite being a very comprehensive measure of the multidimensional nature of prosperity, the GNH Index has failed to inspire any attempts to modify and adapt it by any other country in the world. Even after a decade of it first publication and despite the huge propaganda accompanying it, the index remains what it is – a measure of gross national happiness of the Kingdom of Bhutan. In direct contrast to the case with GNH Index, the Prosperity Index of the Legatum Institute,
UK, is by design and construct a universal measure of prosperity. In consecutive publication since 2007, the Legatum Prosperity Index assess the prosperity of 167 countries based on a larger set of indicators than the GNH Index. The indicators have been carefully selected to cover the widest possible number of countries across all the dimensions and have been rigorously tested for
construct validity and robustness of measure. Studies have shown the appropriateness of LPI compared to other measures of wellbeing/happiness/prosperity (Otoiua, Titanb, & Dumitrescuc, 2014) as well as it to have successfully incorporated human needs and instability theories in its constructs. (Khan & Ahmed, 2017)
The Sustainable Development Goals of the United Nations leave the task of constructing an index to the end user. More than acknowledging the fact that every country is not at the same level of achievement or deprivation, the absence of an (official) index is an acceptance of the fact that goals are not well-articulated, the underlying targets are not well-defined, and the metrics to measure them are non-existent in many cases. Since, the Indicator Framework needs to be discussed and ratified by large group, the process is inherently slow. Even after five years of their adoption, the goals, their targets, and the metrics tracking them are still an unfinished task. It is because of this that the SDSN-BS Global SDG Index use datasets and indicators of their own and yet has not been able to decide upon a fixed set of indicators and metrics to construct the index. Despite releasing the first global index in 2016 itself, the SDSN-BS have been constantly revising their set of indicators and metrics which renders it impossible to compare indices of successive years and thus assess the progress made by a country over the years. Efforts of individual countries at constructing their own official indices, such as the SDG India Index, also beset with the same shortcomings. Moreover, indices by individual countries cannot be used for making inter-country comparisons as their methodology and construction varies.
The arguments presented above attest the suitability of the Legatum Prosperity Index – the revised 2019 model – for assessing a country’s level of attainment of prosperity as well as for making inter-country comparisons across various dimensions of prosperity. The LP Index is particularly suitable for analyzing and framing appropriate and effective actionable policy frameworks and, thus, is recommended to researchers, academicians, and policy makers for designing studies, analyzing results, and framing policies.
REFERENCES
Adelman, S. (2018). The Sustainable Development Goals, Anthropocentrism and Neoliberalism.
In D. French, & L. J. Kotzé, Sustainable Development Goals: Law, Theory and Implementation. Cheltenham: Edward Elgar Publishing Limited.
Alkire, S. (2008, November 01). Bhutan: GNH Index 2008. OPHI Research in Progress, pp. 1-7. Alkire, S., & Foster, J. (2008, January 01). Counting and Multidimensional Poverty
Measurement. OPHI Working Paper Series (07), pp. 01-33.
Bate, R. (2009, October). What Is Prosperity and How Do We Measure It? Development Policy Outlook, 03, 01-07.
Brooks, J. S. (2013, August 26). Avoiding the Limits to Growth: Gross National Happiness in Bhutan as a Model for Sustainable Development. Sustainability, 5, 3640-3664.
Costanza, R., Hart, M., Posner, S., & Talberth, J. (2009, January). Beyond GDP: The Need for New Measures of Progress. The Frederick S. Pardee Center for the Study of the Longer- Range Future. Boston: Boston University.
Daly, H. E. (1996). Beyond Growth: The Economics of Sustainable Development. Boston, Massachusetts, United States: Beacon Press.
Dickinson, E. (2011, January Monday). IN BOX. Retrieved January 2020, from Foreign Policy: https://foreignpolicy.com/2011/01/03/gdp-a-brief-history/
Fukuda-Parr, S. (2016). From the Millennium Development Goals to the Sustainable Development Goals: Shifts in Purpose, Concept, and Politics of Global Goal Setting for Development. Gender & Development, 1-11.
Goossens, Y., Mäkipää, A., Schepelmann, P., Sand, I. v., Kuhndt, M., & Herrndorf, M. (2007). Alternative Progress Indicators to Gross Domestic Product (GDP) as a means towards Sustainable Development. Committee on the Environment, Public Health and Food Safety, Policy Department, Economic and Scientific Policy. Brussels: European Parliament.
Gross National Happiness Commission. (2008, January 01). Five Year Plan 2008-2013. Gross National Happiness Commission. Thimpu: Royal Government of Bhutan. Retrieved July 2020, from Gross National Happiness Commission: https://www.gnhc.gov.bt/en/?page_id=15
Gross National Happiness Commission. (2013). Eleventh Five Year Plan 2013-2018. Gross National Happiness Commission. Thimpu: Royal Government of Bhutan.
Gross National Happiness Commission. (2017, January 01). Background of GNHC. (R. G. Bhutan, Producer) Retrieved July 2020, from Gross National Happiness Commission: https://www.gnhc.gov.bt/en/?page_id=1065
Hák, T., ková, S. J., & Moldan, B. (2015, August). Sustainable Development Goals: A Need for Relevant Indicators. Ecological Indicators, 60, 565-573.
Independent Group of Scientists appointed by the Secretary-General. (2019). Global Sustainable Development Report 2019: The Future is Now – Science for Achieving Sustainable Development. United Nations, Department of Economic and Social Affairs. New York: United Nations.
International Institute of Management. (2018, June 10). Gross National Happiness & Well-being Index: A New Socioeconomic Development Policy Framework. Retrieved July 2020, from International Institute of Management: https://www.iim- edu.org/grossnationalhappiness/index.htm
Khan, A. J., & Ahmed, R. (2017). Prosperity and Instability: An Evaluation of Legatum Prosperity Index. Redefining Prosperity Paths in Changing Global Economy: Opportunities and Challenges for Pakistan (pp. 407-431). Islamabad: Pakistan Society of Development Economists.
Kuznets, S. (1934). National Income, 1929-32. Division of Economic Research, Bureau of Foreign and Domestic Commerce. Washington, D.C.: U.S. Government Printing Office.
Munro, L. T. (2016). Where did Bhutan’s gross national happiness come from? The origins of an invented tradition. Asian Affairs, 47(1), 71-92.
NITI Aayog. (2018). SDG India Index: Baseline Report 2018. National Institution for Transforming India. New Delhi: NITI Aayog.
NITI Aayog. (2019). SDG India Index and Dashboard 2019-20. National Institution for Transforming India. New Delhi: NITI Aayog.
Nussbaum, M. (2011). Creating Capabilities: The Human Development Approach. Cambridge, Massachusetts: Belknap Press.
Otoiua, A., Titanb, E., & Dumitrescuc, R. (2014, July 15). Are the Variables used in building Composite Indicators of Well-being Relevant? Validating Composite Indexes of Well- being. Ecological Indicators, 46, 575-585.
Petty, W. (1899). The Economic Writings of Sir William Petty (Vol. I). (C. H. Hull, Ed.) Cambridge: Cambridge University Press.
Planning Commission. (2003, January 01). Five Year Plan 2003-2008. Planning Commission.
Thimpu: Royal Government of Bhutan. Retrieved July 2020, from Gross National Happiness Commission: https://www.gnhc.gov.bt/en/?page_id=15
Rinzin, C. (2006). On the Middle Path: The Social Basis for Sustainable Development in Bhutan.
Nederlandse Geografische Studies, 352.
Sachs, J. D., Schmidt-Traub, G., Kroll, C., Lafortune, G., Fuller, G., & Woelm, F. (2020). Sustainable Development Report 2020: The Sustainable Development Goals and COVID-19.
Sustainable Development Solutions Network and Bertelsnann Stiftung. Cambridge: Cambridge University Press.
Schmidt-Traub, G., Kroll, C., Teksoz, K., Durand-Delacre, D., & Sachs, J. D. (2017, July 17).
National baselines for the Sustainable Development Goals assessed in the SDG Index and Dashboards. Nature Geoscience, 10, 547-555.
Sen, A. (1999). Commodities and Capabilities. New Delhi, India: Oxford University Press. Soubbotina, T. P. (2004). Beyond Economic Growth: An Introduction to Sustainable
Development. Washington, D.C., United States: The World Bank.
Stiglitz, J. E., Sen, A., & Fitoussi, J.-P. (2010). Mismeasuring Our Lives: Why GDP Doesn't Add Up. The Commission on the Measurement of Economic Performance and Social Progress. New York: The New Press.
Stroud, P. (2019). Foreword to the Legatum Prosperity Index 2019 Report. In T. L. Institute, The Legatum Prosperity Index 2019. London, The UK: The Legatum Institute Foundation.
The Economist. (2015, March 28). The 169 Commandments. The Economist, p. 10.
The Legatum Institute. (2019). The Legatum Prosperity Index 2019: Methodology Report. The Legatum Institute. London: The Legatum Institute Foundation.
The Legatum Institute. (2019). The Legatum Prosperity Index 2019. The Legatum Institute.
London: The Legatum Institute Foundation.
The Legatum Institute. (2019). The Legatum Prosperity Index: Pillar and Element Profiles.
London, The UK: The Legatum Institute Foundation.
The Oxford Poverty and Human Development Initiative. (2007, July 02). About. Retrieved July 2020, from Oxford Poverty and Human Development Initiative: https://ophi.org.uk/about/
United Nations. (2015, October 21). UN General Assembly Resolution 70/1. Transforming our world: the 2030 Agenda for Sustainable Development. New York City, New York, United States: United Nations.
United Nations. (2017, July 06). UN General Assembly Resolution 71/313. Global indicator framework for the Sustainable Development Goals and targets of the 2030 Agenda for Sustainable Development. New York City, New York, United States: United Nations.
United Nations. (2020, June 01). The Sustainable Development Agenda. Retrieved July 2020, from Sustainable Development Goals: https://www.un.org/sustainabledevelopment/development-agenda/
Ura, D. K., Alkire, S., & Zangmo, T. (2011). The Gross National Happiness Index of Bhutan: Method and Illustrative Results. Thimpu, Bhutan: The Centre for Bhutan Studies.
Ura, K., Alkire, S., & Zangmo, T. (2012, April 04). Gross National Happiness and the GNH Index. World Happiness Report.
Ura, K., Alkire, S., & Zangmo, T. (2012). A Short Guide to Gross National Happiness Index.
Thimpu, Bhutan: The Centre for Bhutan Studies.
Ura, K., Alkire, S., Zangmo, T., & Wangdi, K. (2012). An Extensive Analysis of GNH Index.
Thimpu, Bhutan: The Centre for Bhutan Studies.
Weber, H. (2017, January 24). Politics of ‘Leaving No One Behind’: Contesting the 2030 Sustainable Development Goals Agenda. Globalizations, 1-16.