Subscribe now to get notified about IU Jharkhand journal updates!
Factors affecting acceptance of Microfinance products and the role they play in financial inclusion
Abstract :
Microfinance provides a crucial support system for reaching out to the otherwise financially
deprived and is a vital cog in aiding financial inclusion. Thus, understanding the various
factors that affect acceptance of microfinance products in the target segment and analyzing
the role that these factors play in financial inclusion would be very useful for policy makers
in decision making. This paper attempts to review the body of existing knowledge on the
topic in order to present a coherent and summarized picture on the topic. Specifically, this
paper analyzes what are the key variables that affect demand for microfinance products, and
in a broader context how they affect financial inclusion vis-à-vis Government scheme driven
efforts to improve financial inclusion. Relevant academic publications from databases like
EBSCO, Elsevier, JSTOR and open-sourced databases were studied, and twentystudies have
been included in the review based on their relevance to the topic. Results of the study show
that within India, there is disparity in financial inclusion. The study identified several factors
that affect acceptance of microfinance products, significant among which are gender, age,
education, income, the stability of the financial sector, and location. The study also identified
that scheme driven efforts to improve financial inclusion could not sustain the financial
inclusion momentum. This study provides a summarized and organized review of existing
work in the areas of microfinance and financial inclusion, and therefore has significant
implications for researchers, students, executives and policy making.
Keywords :
Microfinance, Government scheme, financial sector, financial inclusion1.Introduction
Microfinance plays a very important role in the economic development of a country like India, where the formal mainstream financial institutions find it very difficult to reach out to a vast segment of population. It involves provision of loans and other financial services specifically for low-income groups. For successful execution of important national policies like poverty reduction, assisting vulnerable groups and empowerment of women, microfinance has the potential to play a very important role. However, against this backdrop it has been observed that penetration of financial products and services especially in the hinterlands is quite poor. As per the Government of India Population Census 2011, only 58.7% of households are availing banking services in the country (Source: RBI). This clearly indicates a lot of scope for improvement. According to the NABARD All India Rural Financial Inclusion survey 2016-17, one fourth of the rural households surveyed in the country reported to have been associated with one or more of the microfinance institutions. This again indicates a rather low penetration of microfinance products and services in the country. It therefore becomes important to understand the various factors that affect the acceptance of microfinance products specially in the low-income group, as this has significant implications for policy decisions.
Microfinance products and services ideally should lead to financial inclusion by taking such products and services to the unbanked groups. Apart from microfinance, there are several initiatives which have been taken by the Government to promote financial inclusion, e.g., Pradhan Mantri Jan Dhan Yojana (PMJDY), Stand Up India Scheme, etc. It is therefore important to understand how they affect financial inclusion vis-à-vis microfinance products and services.
To this aim, this paper has aimed to review the body of existing knowledge on the topic in order to present a coherent and summarized picture on the topic. The review has been guided by the following main research questions:
- RQ1 - What are the factors that affect the acceptance of microfinance products?
- RQ2 - What is the current state of financial inclusion in India?
- RQ3 - What is the efficacy of Government scheme driven efforts to improve financial inclusion?
This review paper has focussed on select and relevant published articles within the last twenty years in the areas of Microfinance and financial inclusion. In terms of structure of the paper, the next section will deal with methodology. Thereafter, the results of the review will be discussed, followed by discussions relating to the research questions. Finally, scope for future research will be discussed.
2. Methodology
This paper is a review paper. The following sections deal with data collection, selection of review articles and the method of data extraction.
2.1 Data Collection
Secondary data in the form of relevant academic publications from databases like EBSCO, Elsevier, JSTOR and open-sourced databases were sourced. These databases were searched with the keywords: microfinance, financial inclusion, micro banking, and schemes for financial inclusion.
2.1 Study Selection and Data Extraction
Following sourcing of articles, duplicate articles within and across databases were discarded. Thereafter, abstracts of retrieved articles were analyzed to find out relevance to the research questions. Finally, after another round of discarding articles whose full text was available, twenty articles were included for the purpose of this review study.
3. Analysis of Results
3.1 Factors affecting acceptance of Microfinance Products
(Basu& Srivastava, 2005) have studied the potential and possibilities of increasing rural credit access through Microfinance. They observed that as compared to Bangladesh where sixty five percent of poor rural households have access to Microfinance, in India only five percent of similar households have access to Microfinance, and that too more predominantly in the Southern states. SHG - bank linkage makes up the largest component of microfinance in India in terms of scale and geographical outreach. While SHG - bank linkage benefits the poor segment in general, there exist differences between states. In Andhra Pradesh, which is a southern state, size of the village is significant with reference to the SHG model. The number of SHGs varies directly with the size of the village. Poorer villages with higher levels of illiteracy and poverty, and those villages which are more remote have lesser number of SHGs. Other important results of the study show that neither per capita income of the village nor income inequality within the village significantly affects the number of SHGs, which indicates a poor linkage between poverty and presence of SHGs.
(Panda, 2016)examined the role of trust and intermediary functions in microfinance and microenterprise development. The methodology adopted was focus group discussions and in-depth personal interviews with fifteen SHGs from across India. The study observed that for both microfinance group formation and subsequent operations, peer trust was higher than intermediary trust. However, during microenterprise development, the level of intermediary trust was higher than peer trust. The intermediary trust was found to be higher for those who adopted entrepreneurship earlier as compared to late adopters.
(Sinha, 2005) hasfocussed on three models of microfinance in India, i.e., the SHG model, the Grameen model, and the individual banking model.The study analysed the performance of twenty select Microfinance institutions (MFI) from across the country in terms of use of their services by clients. The selected MFI had representations from all the three models. The study found that microcredit constitutes 42% of aggregate client household borrowings, with the balance coming primarily from money lenders and personal informal sources. The reason behind this is that MFI are more stringent on credit purpose, timeliness and repayment terms. The study found that the SHG model facilitates access to poorer clients, who are less credit worthy for larger MFI loans. MFI loan use for enterprise is more prominent in the Grameen model.
(Ghosh, 2013) has examined the experience of India, which had one of the largest microfinance sectors in the world. The study observed that microfinance alone would not be able to achieve the development that policy makers seek,and profit-oriented microfinance institutions were problematic in this regard. To fulfill the progressive goals, profit-oriented microfinance institutions need to be regulated and subsidized.Moreover, other strategies for viable financial inclusion of the poor and of small producers must be more actively pursued.
(Shylendra, 2006) highlightedconflict between state and civil society organizations following the closure of fifty branches of two major microfinance institutions in the state of Andhra Pradesh following allegations that they were charging very high interest rates and indulging in forced loan practices. The crisis also showcased the structural problems of MFIs, which are leading to huge burden on the poor.
3.2 Current state of financial inclusion in India
(Dar & Ahmed, 2020)studied determinants of financial inclusions and its impediments in India. Their findings showed that gender, age, education and income had a significant impact on the various measures of financial inclusion. Additionally, these factors had a significant impact on the informal saving and borrowing. The results showed that policymakers should focus on the female population, in particular, and education and income enhancing measures, in general, to make financial inclusion more inclusive.
(Ozili, 2021) provided a comprehensive review of the recent evidence on financial inclusion from all the regions of the World. He identified the emerging themes in the financial inclusion literature as well as some controversy in policy circles regarding financial inclusion. The key findings indicated that financial inclusion affects, and was influenced by, the level of financial innovation, poverty-levels, the stability of the financial sector, the state of the economy, financial literacy, and regulatory frameworks which differed across countries.
(Goel & Sharma, 2017) introduced an index that allowed for a general overview of FI of India. In previous studies, indices were computed by some select indicators of banking such as Banking penetration, Availability of banking services and Usage of banking system. In this study, other indicators such as access to savings and access to Insurance have also been considered. FII was constructed for a longer time period of 12 years. It considered 3 dimensions for preparing the FII. First was the Banking Penetration (D1). Thus, if every person in an economy had a bank account, then the value of this measure would be 1. This was measured by the demographic branch penetration i.e., no. of accounts (deposits and loans) per 1,000 populations with different financial institutions (d1). Second, availability (D2) of banking services in demographic as well as geographic terms i.e., the no. of ATMs per 1,00,000 population (d2), no. of bank branches per 1,00,000 population (d3), no. of ATMs per 1,000 sq. km (d4) and no. of scheduled commercial banks per 1,000 sq. km (d5). Third, Access to Insurance (D3). It was measured as the no. of life insurance (LIC) offices (d6). From the computation of FII, it was found that during 2005-2012, India was categorized under low FI (0 - 0.4), during 2013 under medium FI (0.4- 0.6) and during 2014-2015 under high FI (0.6- 1). By accomplishing high FI, it would be easy to promote inclusive growth, reduce farmers' indebtedness, promote grassroots innovations and entrepreneurship, improve standard of living etc.
(Zins & Weill, 2016)examined the determinants of financial inclusion in Africa. They performed probit estimations using World Bank's Global Findex database on 37 African countries. They fund that richer, educated, with higher income and older men favored financial inclusion. They observed that the determinants of informal finance differed from those of formal finance. Their work contained findings to design policies to foster financial inclusion in African countries
(Roy Choudhury & Bagchi, 2016)tried to find out the basic reasons behind financial exclusion in a developing country like India. They also tried to analyze the reasons behind very slow improvement in this aspect. Going through the response of 100 respondents from different location of West Bengal, India, they showed that 'work status', 'head of the family's saving habit', 'education' and 'location'
have significant relationship with financial exclusion. Further, they tried to analyze the fact that all these variables acted as reasons as well as effects of financial exclusion and therefore, it became really difficult to reduce the amount of financial exclusion from a developing country like India.
(Sethy, 2016)against the backdrop that the rural people lacked knowledge about the entire range of financial services such as: opening bank accounts and credit etc. and that money lenders in India still dominated the rural credit markets, took into account different variables and constructed a new FII through which one can know about the banking services development in a country or a particular state and to include the entire section of the society under a single roof of financial services. In the previous studies, indices were computed using select indicators of banking only (such as Banking penetration, Availability of banking services and Usage of banking system) whereas this study considered other potential banking services such as Banking Risk, Access to savings and Access to Insurance. It took into consideration Supply (SS) and Demand (DD) side indicators of financial services and developed 2 separate types of FII such as: FII with DD side indicators i.e., FIID and FII with SS side indicators i.e., FIIS. DD side Indicators (calculation period is 2004-2012) were:
(a) Banking Penetration: No. of deposit account with commercial bank per 1000 adults (d1).
(b) Availability of banking services: No. of ATM per 100000 adults (d2), No. of commercial bank branches per 1000 adult (d3).
(c) Usage of the banking system: Outstanding deposit with commercial banks as % of GDP (d4).
SS side Indicators (calculation period is 1975-2012) are:
(a) Access to Saving: Proportion of households having access to savings (d1).
(b) Access to Insurance: Proportion of households having access to insurance (d2).
(c) Bank Risk: No. of loans given to small entrepreneurs (d3).
From the perspective of DD side, India was categorized under low FI (0 - 0.4) during 2004-2008. The major reasons might be the lack of initiatives taken by the GOI and RBI, unawareness about banking policies and the financial crisis (2007-08) etc. In 2009 under medium FI and under high FI during 2010-12. From the perspective of SS side, 1975 -1980, 1981-86 and 2010-2012 India was categorized under medium FI (0.4-0.6) and during 1987-1988 and 1989-2009, under low FI (0 - 0.4). The reasons might be narrowing of the branch network in rural areas, fall in credit deposit ratios in rural areas, high transaction cost, staff attitude, complex products etc. Here, the major difference between FIID and FIIS during the period 2010-2012 was that India was categorized under high FI in case of DD side indicators but low FI in case of SS side indicators.
(Fungáčová& Weill, 2015)analyzed financial inclusion in China and made comparisons with the other BRICS countries. They found that the level of financial inclusion in China was high; it was manifested by greater use of formal account and formal saving than in the other BRICS countries. Instances of financial exclusion was mainly voluntary. They also found that the use of formal credit was however less frequent in China than in the other BRICS countries. They observed that higher income, better education, being a man, and being older were associated with greater use of formal accounts and formal credit in China.
(Mishra et al., 2015)used FII to rank 71 districts of Uttar Pradesh in terms of level of financial penetration based on secondary data. The main objective of the study was to provide a statistically justified method for assignment of appropriate weights to the factors according to their importance and devise a method to obtain individual factor indices. The index was between 0 to ∞, where 0 represented complete financial exclusion. This ranking would help policy makers choose appropriate levers to mitigate complex problem of financial penetration-deficit. Indicators for penetration were: No. of bank branches, No. of ATMs, banking staff (male and female) and Banking Correspondences, per-capita Gross State Domestic Product, no. of Self-Help Groups, no. of unbanked villages, per-capita credit, deposit and credit accounts and total amounts in deposit accounts (male and female) and literacy rate (male and female). According to each factor which influenced FII, all the districts were divided into 4 quartiles (segments) based on value of such factors. Districts in the lowest (4th) segment might be improved and carried to the next (3rd) segment followed by improvement to take it to 2nd and subsequently to 1st quartile, although further improvement in FI was always possible. From the policy makers' point of view, it was essential to know which district was lacking in terms of FI on account of which factor. If it was known, then corresponding improvement on such factor/s might be incorporated in order to improve the level of FI.
(Ambarkhane et al., 2014)argued that in the earlier attempts, indices were computed using select indicators of banking only (such as banking penetration, availability of banking services and usage of banking system) whereas this study considered SS and DD side of financial services such as by NBFCs, Insurance Companies, Pension Schemes in addition to banking. It further included infrastructure factors, both real sector and human resources namely roads, irrigation, power, female literacy and health. The concept of drag was introduced in the measurement of index as these factors had negative impact on FI, i.e., decadal growth rate of population. The index was developed for 21 major states of India and ranking was done. Comparison with other studies was made which showed that index computed, corroborated with them and focused on poor. Comprehensive Index of FI was arrived at, on the basis of the range of index, states were grouped in 4 categories namely High, Higher Middle, Lower Middle and Low. Kerala topped rank as per CFII and M.P. came lowest. Out of 21 states, there were no states under High and Higher Middle category. Kerala and Goa came under lower middle category and all other States were under low category, indicating the scope for further development.
(Morgan &Pontines, 2014)sought to find answers to the question of whether financial stability and financial inclusion were, broadly speaking, substitutes or complements. In other words, does the move toward greater financial inclusion tend to increase or decrease financial stability? Certain studies had suggested both positive and negative ways in which financial inclusion could affect financial stability, but very few empirical studies had been made of their relationship. They realized that it was due to scarcity and relative newness of data on financial inclusion. Their study contributed to the literature on this subject by estimating the effects of various measures of financial inclusion (together with some control variables) on some measures of financial stability, including bank non-performing loans and bank Z scores. They found some evidence that an increased share of lending to small and medium sized enterprises (SMEs) aided financial stability, mainly by reducing non-performing loans (NPLs) and the probability of default by financial institutions. This suggested that policy measures to increase financial inclusion, at least by SMEs, would have the side-benefit of contributing to financial stability as well.
(Demirguc-Kunt&Klapper, 2013)measured how adults in 148 countries saved, borrowed, made payments, and managed risk. They used the data to benchmark financial inclusion-the share of the population that used formal financial services-in countries around the world, and to investigate the significant country- and individual-level variation in how adults used formal and informal financial systems to manage their day-to-day finances and plan for the future. The data showed that 50 percent of adults worldwide had an account at a formal financial institution, but also that account penetration varied across countries by level of economic development and across income groups within countries. For the half of all adults who remained unbanked, they documented reported barriers to account use, such as cost, distance, and documentation requirements, which might shed light on potential market failures and provided guidance to policymakers in shaping financial inclusion policies.
(Gupte et al., 2012)aimed to study the determinants that measured the extent of FI and focused on the computation of an index that would comprehensively capture the impact of multi-dimensional variables with specific reference to India. Past studies had omitted one or the other dimensions impacting FI for various reasons. However, since each of the dimensions was critical, incorporating as many dimensions as possible would result in a more holistic assessment of FI. Further, since index was computed identically over 2 years the result was comparable and highlighted the impact of FI in India in 2008 & 2009. It computed FII as a geometric mean of 4 critical dimensions - Outreach [examined the penetration and accessibility and took into account variables like Geographic Branch Penetration, Geographic ATM penetration, Demographic Branch penetration, Demographic ATM penetration and No. of accounts (deposits & loans) per 1000 adults], Usage (included the Volume of Deposits and loans as % of GDP), Cost of Transactions (included annual fees charged to customers for ATM cards or accounts and the cost of international transfer of money) and Ease of Transactions (comprised of 12 variables). In this case, there were 2 types of variables:
i. Directly related variables: 2 variables in this dimension - no. of locations to open Deposit or loan accounts, which were directly proportional to the ease of transactions.
ii. Inversely related variables: 10 variables in this dimension refered to the affordability of deposits or loans - minimum amt. to open savings or checking accounts, minimum amt. of consumer or mortgage loans, no. of documents to open savings or checking accounts and no. of days to process loan applications.
FII in India had improved from 2008-2009 and this could be attributed to several initiatives taken by financial regulators, GOI and banking industry. RBI had been undertaking financial inclusion initiatives in a 'mission mode' through a combination of strategies ranging from introduction of new products, relaxation of regulatory guidelines and other supportive measures to achieve sustainable and scalable FI.
(Chakravarty & Pal, 2010)demonstrated that the axiomatic measurement approach developed in the human development literature could be usefully applied to the measurement of FI and a conceptual framework for aggregating data on financial services in different dimensions was developed. The suggested FII allowed calculation of % contributions of different dimensions to the overall achievement. This in turn enabled identifying the dimensions of inclusion that were more/less susceptible to overall inclusion and hence to isolate the dimensions that deserved attention from a policy perspective. 6 attributes of FI were considered: (a) demographic penetration, defined as no. of bank branches per 10 lakh people, (b) geographic penetration, defined as no. of bank branches per 1000 sq. km land area, (c) no. of deposit accounts per 1000 people, (d) no. of credit accounts per 1000 people, (e) deposits-income ratio, and (f) credit-income ratio. Data on these attributes was used for 24 (27) states corresponding to the year 1991, 2001 and 2007. It was observed that there was wide variation in terms of FI across states in India. Surprisingly, the range of the index increased from 0.38 in 1991 to 0.43 in 2001 and further to 0.46 in 2007. Comparing the computed FII for 1991 and 2001, it was found that the levels of FI in India had declined from 1991 to 2001 and the same was true in most of the states also. However, in India as well as in each of its states the levels of FI had increased during 2001-2007. Delhi and Goa had consistently maintained their 1st and 2nd ranks, respectively, in all the 3 years. Nonetheless, relative positions or ranks of states had changed over time. A notable feature was that in all states, except Delhi, contribution of geographical penetration of bank branches to overall achievement was the least.
3.3 Efficacy of Government scheme driven efforts to improve financial inclusion
(Verma & Khan Sophiya, 2018) focused on the role of GOI in the development of FI through regulatory policies and digital means. It highlighted the impact of the introduction of Pradhan Mantri Jan DhanYojna in 2014 and demonetization in 2016 on FI of India. The implementation of PMJDY produced significant impact on FI of India, as within a year of its implementation in 2014, over 35 crore bank accounts were open which led to a boom in the banking penetration numbers. The next steppingstone in the journey of FI came with the introduction of the demonetization in 2016 and the magnified focus on making the transition from a cash-dependent economy to a completely cashless one. The share of digital transactions increased nearly twice from 32% in 2013-14 to 62% in 2017-18 (National Payments Corporation of India reports). There was 408% increase in the use of mobile wallets just after demonetization (RBI). The introduction of payment banks, KYC, Aadhar Pay, BHIM App, UPI, etc. and recent changes in the regulatory policies by GOI had interesting impact on the FII. The increased access to mobile phones by the unbanked population is the most effective method of providing financial services and thereby reaching an even and inclusive growth. A new relative FII had been developed over 4 years (2014-2017) that captured the before and after scenarios of landmark steps. Further, a quantitative approach was presented to calculate FII which took into account mobile money, e-wallets and payment banks. 3 basic dimensions of an inclusive financial system were considered: Banking penetration - no. of deposit bank accounts and no. of mobile wallet accounts population as an indicator; Availability of the banking services - no. of branches of Basic Savings Bank Deposit Account (per 1000 population); Usage of the banking system - outstanding credit in banks. In order to include the mobile wallets factors, the value of transactions in the domain for the duration 2014-2017 was included. No. of mobile wallet account penetration corresponded to the sum of top 5 companies in the E wallets market, namely, Paytm, Itz Cash, Mobikwik, Citrus Pay, Oxigen Wallets and Freecharge. It was observed that the actual FI of India was high. In 2017, the year after demonetization, increase in index was as close to 50% after inclusion of mobile money. If FI of India was observed without considering mobile money, the increasing trend seemed to get saturated. However, there was a lot of scope for increasing index by focusing on the system that relied on mobile financial services.
(Singh et al., 2020)examined the status of FI across 25 major Indian states for the year 2011 and 2016. Further, the study also examined the impact of PMJDY scheme on the status of FI and economic development across Indian states. 3 dimensions of F.I. namely, availability, penetration and usage were used to calculate FII, defined as: Penetration - no. of bank accounts with commercial bank per 1000 adults; Availability - no. of commercial bank branches per 100000 adults; Usage - the volume of credit and deposit as a proportion of the state's Net State Domestic Product. Real per capita gross state domestic product was taken as a proxy for economic performance and gross fixed capital formation was taken proxy for capital stock. The major finding of the study suggested that the majority of states fell under the low or medium level of FI for the year 2011 and 2016. In 2011, out of 25 Indian states, only Goa was under high FI category (0.734), 6 states (Maharashtra, Punjab, Kerala, Karnataka, T.N. and H.P.) under medium FI and rest 18 states (A.P., Uttarakhand, Haryana, Sikkim, J&K, W.B., Gujrat, U.P., Odisha, Meghalaya, M.P., Jharkhand, Rajasthan, Chhattisgarh, Assam, Bihar, Nagaland and Manipur) was in the low FI category. Similarly, in the year 2016, Goa was the only state which was under high FI, 7 states (Maharashtra, Punjab, Kerala, T.N., Karnataka, H.P. and Haryana) was in the medium category and rest of the 17 states (A.P., Uttarakhand, W.B., J&K., Sikkim, Gujrat, Odisha, Jharkhand, U.P, M.P., Meghalaya, Chhattisgarh, Bihar, Rajasthan, Assam, Nagaland and Manipur) were found under low FI. Empirical result showed that there was no significant improvement in the status of FI across states during 2011 and 2016. Cross sectional and pooled OLS techniques were employed to examine the impact of FI augmented through PMJDY scheme on economic development. Empirical evidence confirmed that PMJDY scheme failed to augment FI and economic development across Indian states. Major reasons behind the failure of PMJDY scheme were lack of human development, physical infrastructure and effective governance.
4. Discussion
The study reveals interesting aspects regarding what affects acceptance of microfinance products and services. Among the different models of microfinance available in the country, viz. the SHG model, the Grameen model and the Individual Banking model, the SHG model is the most prevalent. It has been revealed that access to Microfinance products and services is very limited in India, when compared to neighbouring Bangladesh. Moreover, there is disparity within the country with the Southern states being more active than others with regard to access to microfinance products and services.
Table 1 summarizes the important factors affecting acceptance of microfinance products and the manner in which they affect.
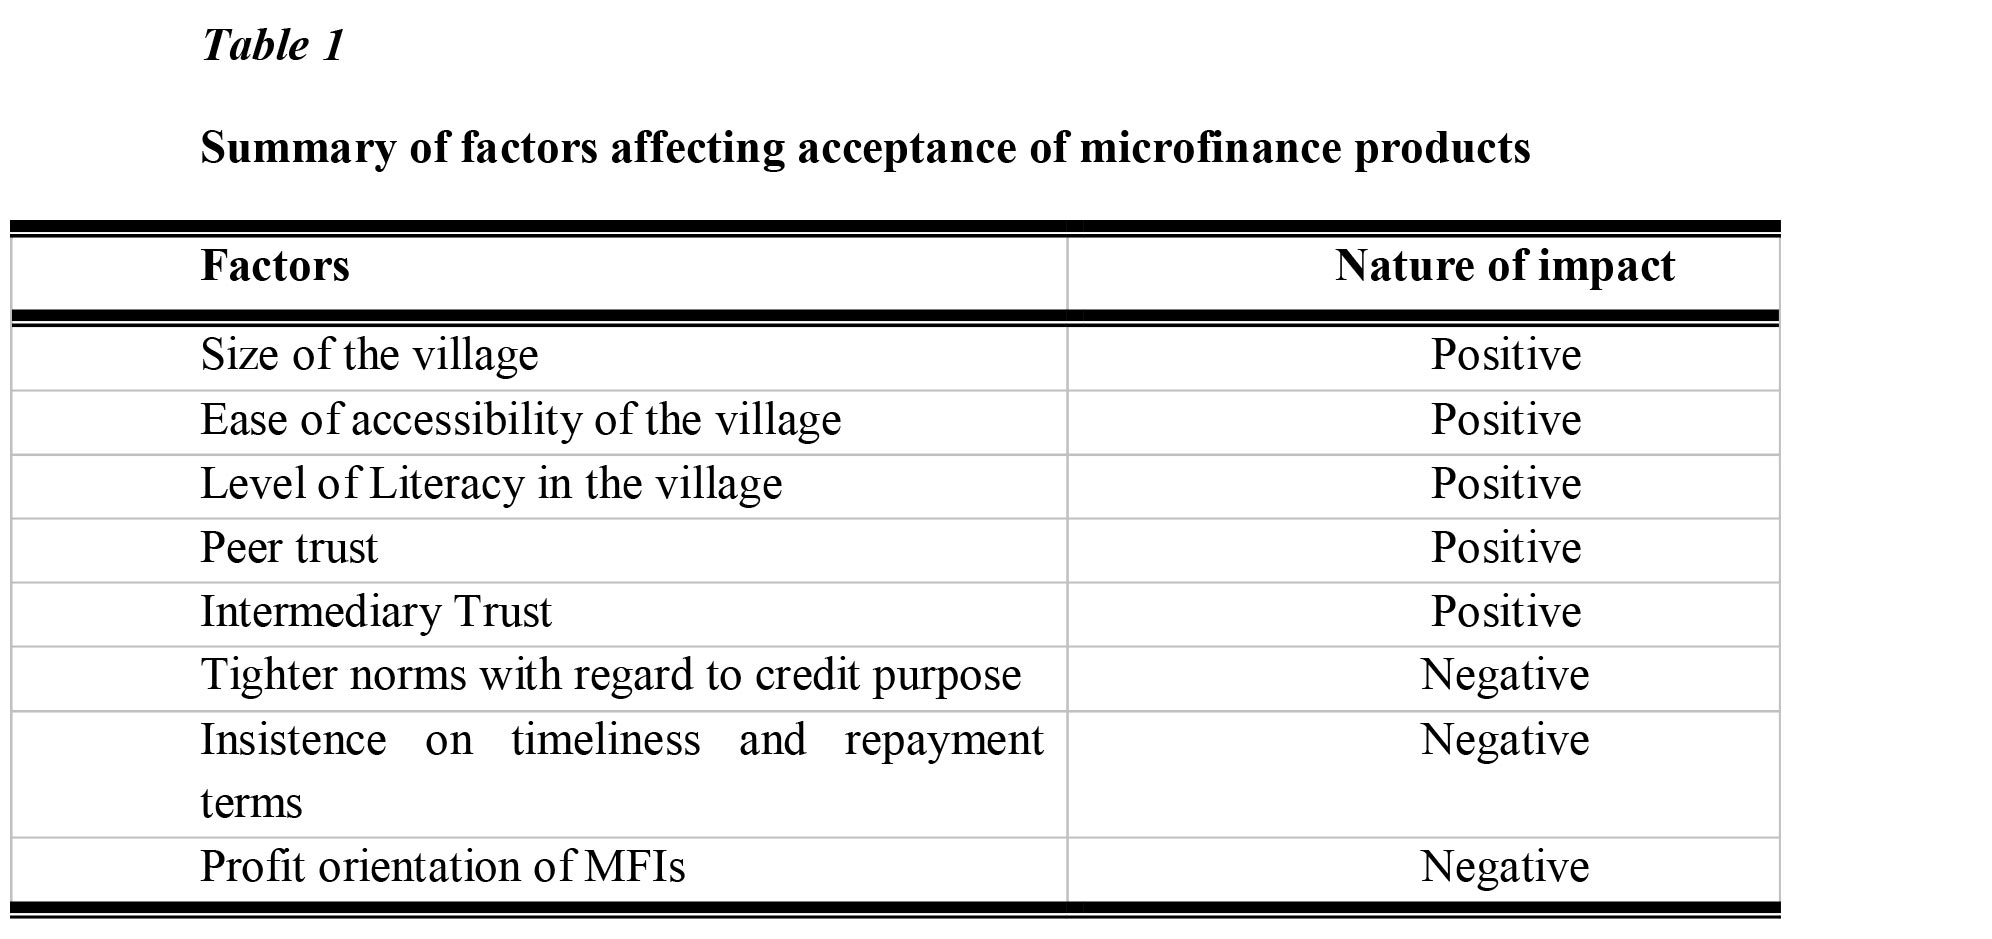
It becomes evident from the above that microfinance access is not reaching the poorer groups effectively which is a concern. Bigger, more easily accessible villages have greater access to microfinance, with the more literate groups being better off. In the context of SHG model, higher level of trust between community members aids in the formation of SHGs. Tighter credit norms, insistence on timeliness and repayment terms negatively affect the acceptance of microfinance products and services. Profit orientation of MFIs lead to exorbitant rates and questionable collection practices, which coupled with lack of regulations negatively affect the acceptance of microfinance products and the reliance on informal money lenders continues in the hinterlands.
The state of financial inclusion in India has been discussed at length by the researchers along with its determinants. Some studies have focused on Financial Inclusion Indices to measure the level of Financial Inclusion in different parts of the country. The studies have indicated that there is disparity regarding financial inclusion between different regions and states of the country. The significant determinants of financial inclusion are age, gender, education, penetration of the banking system, awareness and knowledge of financial products, stability of the financial sector, innovation, and access to microfinance products.
Researchers have observed that Government driven schemes like PMJDY had a significant impact on Financial Inclusion and provided a boost to inclusion. However, the efficacy varied greatly between different regions of the country and was dependent on penetration of banking services, and physical infrastructure.
5. Conclusion
This study has been an attempt to obtain a substantial and comprehensive picture of existing body of knowledge in the area of factors affecting acceptance of microfinance products and services in India, and the state of financial inclusion in the country. The study has established that access to microfinance is limited and there is scope for far greater access. The key factors that affect acceptance of microfinance have also been analyzed.
The state of financial inclusion along with its key determinants have also been analyzed, and it has been observed that there exists disparity in financial inclusion between the different states of the country. The study therefore has significant implications for researchers, students, executives and policy makers.
Future research can focus on the potential for increasing access to microfinance products and services through women entrepreneurship, as not much work has been in this area.
References
Basu, P., & Srivastava, P. (2005). Exploring Possibilities: Microfinance and Rural Credit Access for the Poor in India. Economic and Political Weekly, 40(17), 1747-1756. http://www.jstor.org/stable/4416534
Panda, D. K. (2016). Trust, Social Capital, and Intermediation Roles in Microfinance and Microenterprise Development. Voluntas: International Journal of Voluntary and Nonprofit Organizations, 27(3), 1242-1265. http://www.jstor.org/stable/43923228
Frances Sinha. (2005). Access, Use and Contribution of Microfinance in India: Findings from a National Study. Economic and Political Weekly, 40(17), 1714-1719. http://www.jstor.org/stable/4416529
Ghosh, J. (2013). Microfinance and the challenge of financial inclusion for development. Cambridge journal of economics, 37(6), 1203-1219.
H. S. Shylendra. (2006). Microfinance Institutions in Andhra Pradesh: Crisis and Diagnosis. Economic and Political Weekly, 41(20), 1959-1963. http://www.jstor.org/stable/4418232
Dar, A. B., & Ahmed, F. (2020). Financial inclusion determinants and impediments in India: insights from the global financial inclusion index. Journal of Financial Economic Policy.
Ozili, P. K. (2020, January). Financial inclusion research around the world: A review. In Forum for social economics (pp. 1-23). Routledge.
Goel, S., & Sharma, R. (2017). Developing a financial inclusion index for India. Procedia computer science, 122, 949-956.
Zins, A., & Weill, L. (2016). The determinants of financial inclusion in Africa. Review of development finance, 6(1), 46-57.
Choudhury, S. R., & Bagchi, D. (2016). Financial Exclusion-A Paradox in Developing Countries. Journal of Economics and Finance, 3(1), 40-45.
Sethy, S. K. (2016). Developing a financial inclusion index and inclusive growth in India. Theoretical and applied economics, 23(2), 607.
Fungáčová, Z., & Weill, L. (2015). Understanding financial inclusion in China. China Economic Review, 34, 196-206.
Mishra, D., Rabi, N., Verma, P., & Bose, S. (2015). Operationalising financial inclusion Index as a policy lever: Uttar Pradesh (in India)-A Case Study. Journal of Mathematics and Statistical Science, 2015, 149-165.
Ambarkhane, D., Singh, A. S., &Venkataramani, B. (2016). Measuring financial inclusion of Indian states. International Journal of Rural Management, 12(1), 72-100.
Morgan, P., &Pontines, V. (2014). Financial stability and financial inclusion.
Demirgüç-Kunt, A., &Klapper, L. (2013). Measuring financial inclusion: Explaining variation in use of financial services across and within countries. Brookings Papers on Economic Activity, 2013(1), 279-340.
Gupte, R., Venkataramani, B., & Gupta, D. (2012). Computation of financial inclusion index for India. Procedia-Social and Behavioral Sciences, 37, 133-149.
Chakravarty, S. R., & Pal, R. (2010). Measuring financial inclusion: an axiomatic approach.
Verma, S. & Khan, S. (2018). "Financial Inclusion Index Approach Unifying E-Wallets", International Journal of Science and Research (IJSR), ISSN (Online): 2319-7064. Index Copernicus Value (2016): 79.57 | Impact Factor (2017): 7.296 Volume 7 Issue 8, August 2018, www.ijsr.net
Singh, B. P., Kumari, A., Sharma, T., & Malhotra, A. (2020). Does PMJDY Scheme Augment Financial Inclusion in India? Evidence from Indian States.