Subscribe now to get notified about IU Jharkhand journal updates!
Financial Fragility of the Real Estate and Construction Sector
Abstract :
We study the Construction and Real Estate (RECON) sector and its constituent subsectors by primarily employing the framework developed by Hyman Minsky for analysing financial fragility. The period of the study is 1994-95 to 2018-19. We use both “cash from operations” and accrual accounting profit to categories the sector and its subsectors into three categories of Minskian financing regimes. Further analysis indicate categorization based on cash flows is more credible. The study indicates that the sector was in speculative and Ponzi regimes for almost the entire period. The study also shows that debt to income ratio is positively related to the degree of financial fragility.
Keywords :
: Real Estate, subsectors, financial fragility, period, profit.Introduction
1.1. The Real Estate and Construction (RECON) sector in India comprises of two different industries i.e. 'Real Estate' and 'Industrial and Infrastructure Construction'. Real estate involves the purchase, sale and development of land, residential and non-residential buildings. It covers residential housing, commercial complexes, shopping malls and theatres, hotels and restaurants, retail outlets.On the other hand, industrial and infrastructural construction includes construction of roads, bridges, tunnels, ports, airports, dams for irrigation, railway lines, metro rail projects, power transmission lines, power plants, other industrial plants and construction of rigs and platforms for exploration activities.In 2019-20 the construction industry alone accounted for 10.4 per cent of total value of national output and 22.1% of the entire industry output .
1.2 This study examines the configuration and evolution of financial fragility (FF) in the India's RECON sector and its constituent sub-sectors using categories developed by Hyman Minsky in his seminal paper on Financial Instability Hypothesis (FIH) (Minsky 1982) and subsequent work. The study identifies the degree of FF, using threesome classification as hedge, speculative and Ponzi regimes. The paper also examines how the sector passed through the three states of FF during 1994-95 to 2018-19.
1.3Theoretical framework
Financial fragility (FF) implies an inability to meet debt commitments from one's own resources. Study of financial fragility therefore involves evaluation of the capacity of economic agents to meet their debt commitments. Hyman P Minsky, in seminal paper Financial Instability Hypothesis [Minsky (1977; also see revised Levy Institute edition 1992) provided the first systematic and coherent framework for assessing financial fragility. His book, Stabilizing and Unstable Economy(H. P. Minsky 2008) provides us the details of his arguments and the theoretical framework.Financial instability emerges when the economy becomes increasingly financially fragile.
FF framework is an interplay between the levels of debt and income. A sustainable level of debt is one that can be serviced and repaid from income flows. Minsky examines the process by which an economy becomes over-leveraged. The activities and capital assets of profit seeking firms are financed by liabilities which result in a series of future payment obligations. Firms' assets and activities themselves generate a separate series of cash flows. The interaction of these two sets of cash flows determine the sustained ability of firms to meet their debt obligations. The less the capacity to meet debt payment commitments, the higher the degree of FF. Minsky categorizes firms into three groups, based on their capacity to meet their cash flow obligations. Hedge units can meet their debt obligations from their operating cash flows. Speculative units can meet their interest liabilities from their operating cash flows, though they do not have adequate operating cash to meet principal repayment obligations. Thus, speculative units roll over or refinance their debt principals, while meeting interest obligations from their operating cash flows. Operating cash flows of Ponzi units are inadequate even to meet their interest obligations. Ponzi units are in a classic debt trap situation and must borrow or sell their assets to meet the interest payment obligations. The health of an economy depends which types of units (or sectors) dominate it. An economy dominated by hedge units is equilibrium seeking. An economy dominated by speculative and Ponzi units has an inherent tendency to amplify deviation from equilibrium.
1.4Literature review
A fundamental theorem of FIH is that in periods of tranquil prosperity, economy transits from a stable system to an unstable one(H. Minsky 1986). Accordingly to FIH, period of tranquillity leads to an expansion of debt financing vis-à-vis equity (pp. 199, 204-205). When the profit rate (Minsky uses the expression “capital income” to indicate income from capital assets) is high corporations use increasing levels of debt in relation to equity to finance (p.205) investment. With increasing investment, return begins to fall. The trend of increasing investment and decreasing returns continue till firms are no longer able to meet the debt service obligation. Minsky's hypothesis is consistent with financial theory investment and has been empirically validated by numerous studies.Leverage ratio of firms rises in periods of investment boom, indicating a more fragile economy(Lavoie 1986-87), whereashigher level of borrowing reduces entrepreneur's stake in the investment and increases agency costs(Bernanke and Gertler 1990).Accordingly, a study using Kaldor's model(Palley 1994), household borrowing initially increases aggregate demand, but later rising debt service payments dents aggregate demand. This mechanism, through an accelerator model,can generate boom-bust cycles.Using plausible values of real interest rates in a model employing Goodwin cycles,the author (Keen 1995)shows that capitalists' expectations of profit during boom phases can lead them to take more debt, than the system is capable of servicing. When a breakdown occurs, the model indicates perpetually increasing level of capitalists' indebtedness. According to another model (Lima and Tadeu 2006)for Minsky's financial regimes involving endogenous money, higher propensity of the economy for hedge regime is shown by higher sensitivity of investment to interest rate and profit rate, while low sensitivity of investment to interest rate and profit rate is indicative of Ponzi regime.A study on corporate leverage and incidence of non-performing loans(Ghosh 2006), finds that a 10 percentage point rise in the corporate leverage is, on average, associated with 1.3 percentage point rise in sticky loans relative to total loans, after a one period lag. The study underlines the importance of leverage ratio of borrowers as a useful signpost of asset quality.In another study(Wray and Tymoigne 2008),the authors use Minsky's financial theory of investment to explain the aetiology of 2008 global crisis.In Mulligan and others [(Mulligan 2013),(Mulligan, Lirely and Coffee 2014)]use interest coverage ratio (ICR) as the measure of FF. Somewhat arbitrarily, authors designate firms with ICR of 4 or more as hedge units, between 4 and zero as speculative units and less than zero as Ponzi units. Authors find strong evidence of FIH. Rozmainsky & Beshenov(Rozmainsky and Beshenov 2015)examines FF in 36 corporations in the context of the Greek debt crisis. They show that the companies were increasing their leverage when profits were booming. As profits fell after 2008 leverage rapidly increased, as the proportion of speculative and Ponzi corporations begin to dominate.Argitisa & Nikolaidi(Argitisa and Nikolaidi 2013)use the framework to analyse the crisis of Greek government sector and evaluate the implementation of fiscal and wage austerity programs in Greece.Bhattacharya (Bhattacharya, et al. 2015)examines the second theorem of Minsky that prolonged period of prosperity sets off an endogenous process of over-indebtedness that leads the economy towards instability. The study finds that the borrowers do not correctly assess (i.e., they undervalue) the system level indebtedness and risk. When bad news arrive, the actual defaults are higher than expected. Thus, this study also validates Minsky's basic work. Charles (Charles 2016) examines the main criticism of FIH about lack of internal coherence in standard macro-economic terms. Using a simplified macroeconomic model, the author observes a trend of declining profitretention rate in a period of boom, reinforcing the view that investments are increasingly financed with debt.Nishi (Nishi 2016)performs an empirical analysis to detect FF in Japan and examines the determinants of FF.Nishi observes that in the manufacturing sector rise in the debt ratio is associated with deterioration of the financial structure of most sectors and sizes except for medium firms. The study notes that FF develops gradually and that smaller firms are more prone to Ponzi states, while the non-manufacturing sector is generally more financially fragile than the manufacturing sector.Davis(Davis, deSouza and Hernandez 2017)analyses the dynamics of financial fragility by applying Minsky's financial regime classification to US corporations. The study finds rising incidence of Ponzi firms across sectors and that smaller firms are more likely to develop Ponzi positions. The authors also finds that Minskian dynamics work as long period business cycles, rather than as short term business cycles. The study is also significant in that it discusses in detail the financial terms that are building blocks Minskian categories. Filho and others(Filho, Martins and Miaguti 2017) evaluate FF of electricity distribution companies. Using the usual threefold taxonomy, they construct a firm level financial fragility index (FFI). Their paper also carries a succinct review of empirical work done on Minsky's financing regime framework.
1.5Scope of the study
The study examines the Constriction and Real Estate Sector (RECON), comprising five subsectors - namely, (1) Industrial Construction Industry (INCON), (2) Housing Construction Industry (HCON), (3) Infrastructural Construction Industry (INFRACON), (4) Other Construction & Allied Activities Industry (ALLIED) and (5) Commercial Complexes Industry (COMP). The period of the study spans from 1994-95 to 2018-19. Primary data issourced from Industry Outlook, CMIE. The total number of companies covered in the dataset vary from year to year - from 124 in 1994-95 to 1570 in 2018-19.
2. Methodology
2.1 Minsky bases his FF categories on a comparison of periodic debt service commitment with the debt service capacity of firms (Minsky, 1986ibid). Periodic debt service commitment is further divided into interest and principal. Minsky compares expected cash flows with near term contractual payments over a fixed term time horizon, usually a year. The expression “contractual” is used frequently by Minsky when signifying debt service commitments. This paper considers interest payment commitment and principal payment commitment over the next one year as contractual payments on debt.
3.2 Sector level assessment:
Minsky's framework uses firm level assessment. This paper uses the concept of FF in relation to sectors and subsectors. Thus ratios used in the paper are not firm level ratios but sector level ratios. In the sector approach, a robust sector is dominated by hedge sub-sectors. Sector level approach also help us avoid the need for sector level aggregation of unit level regimes as well as tide over the unavailability of unit level data over the 25-year period taken for the study.
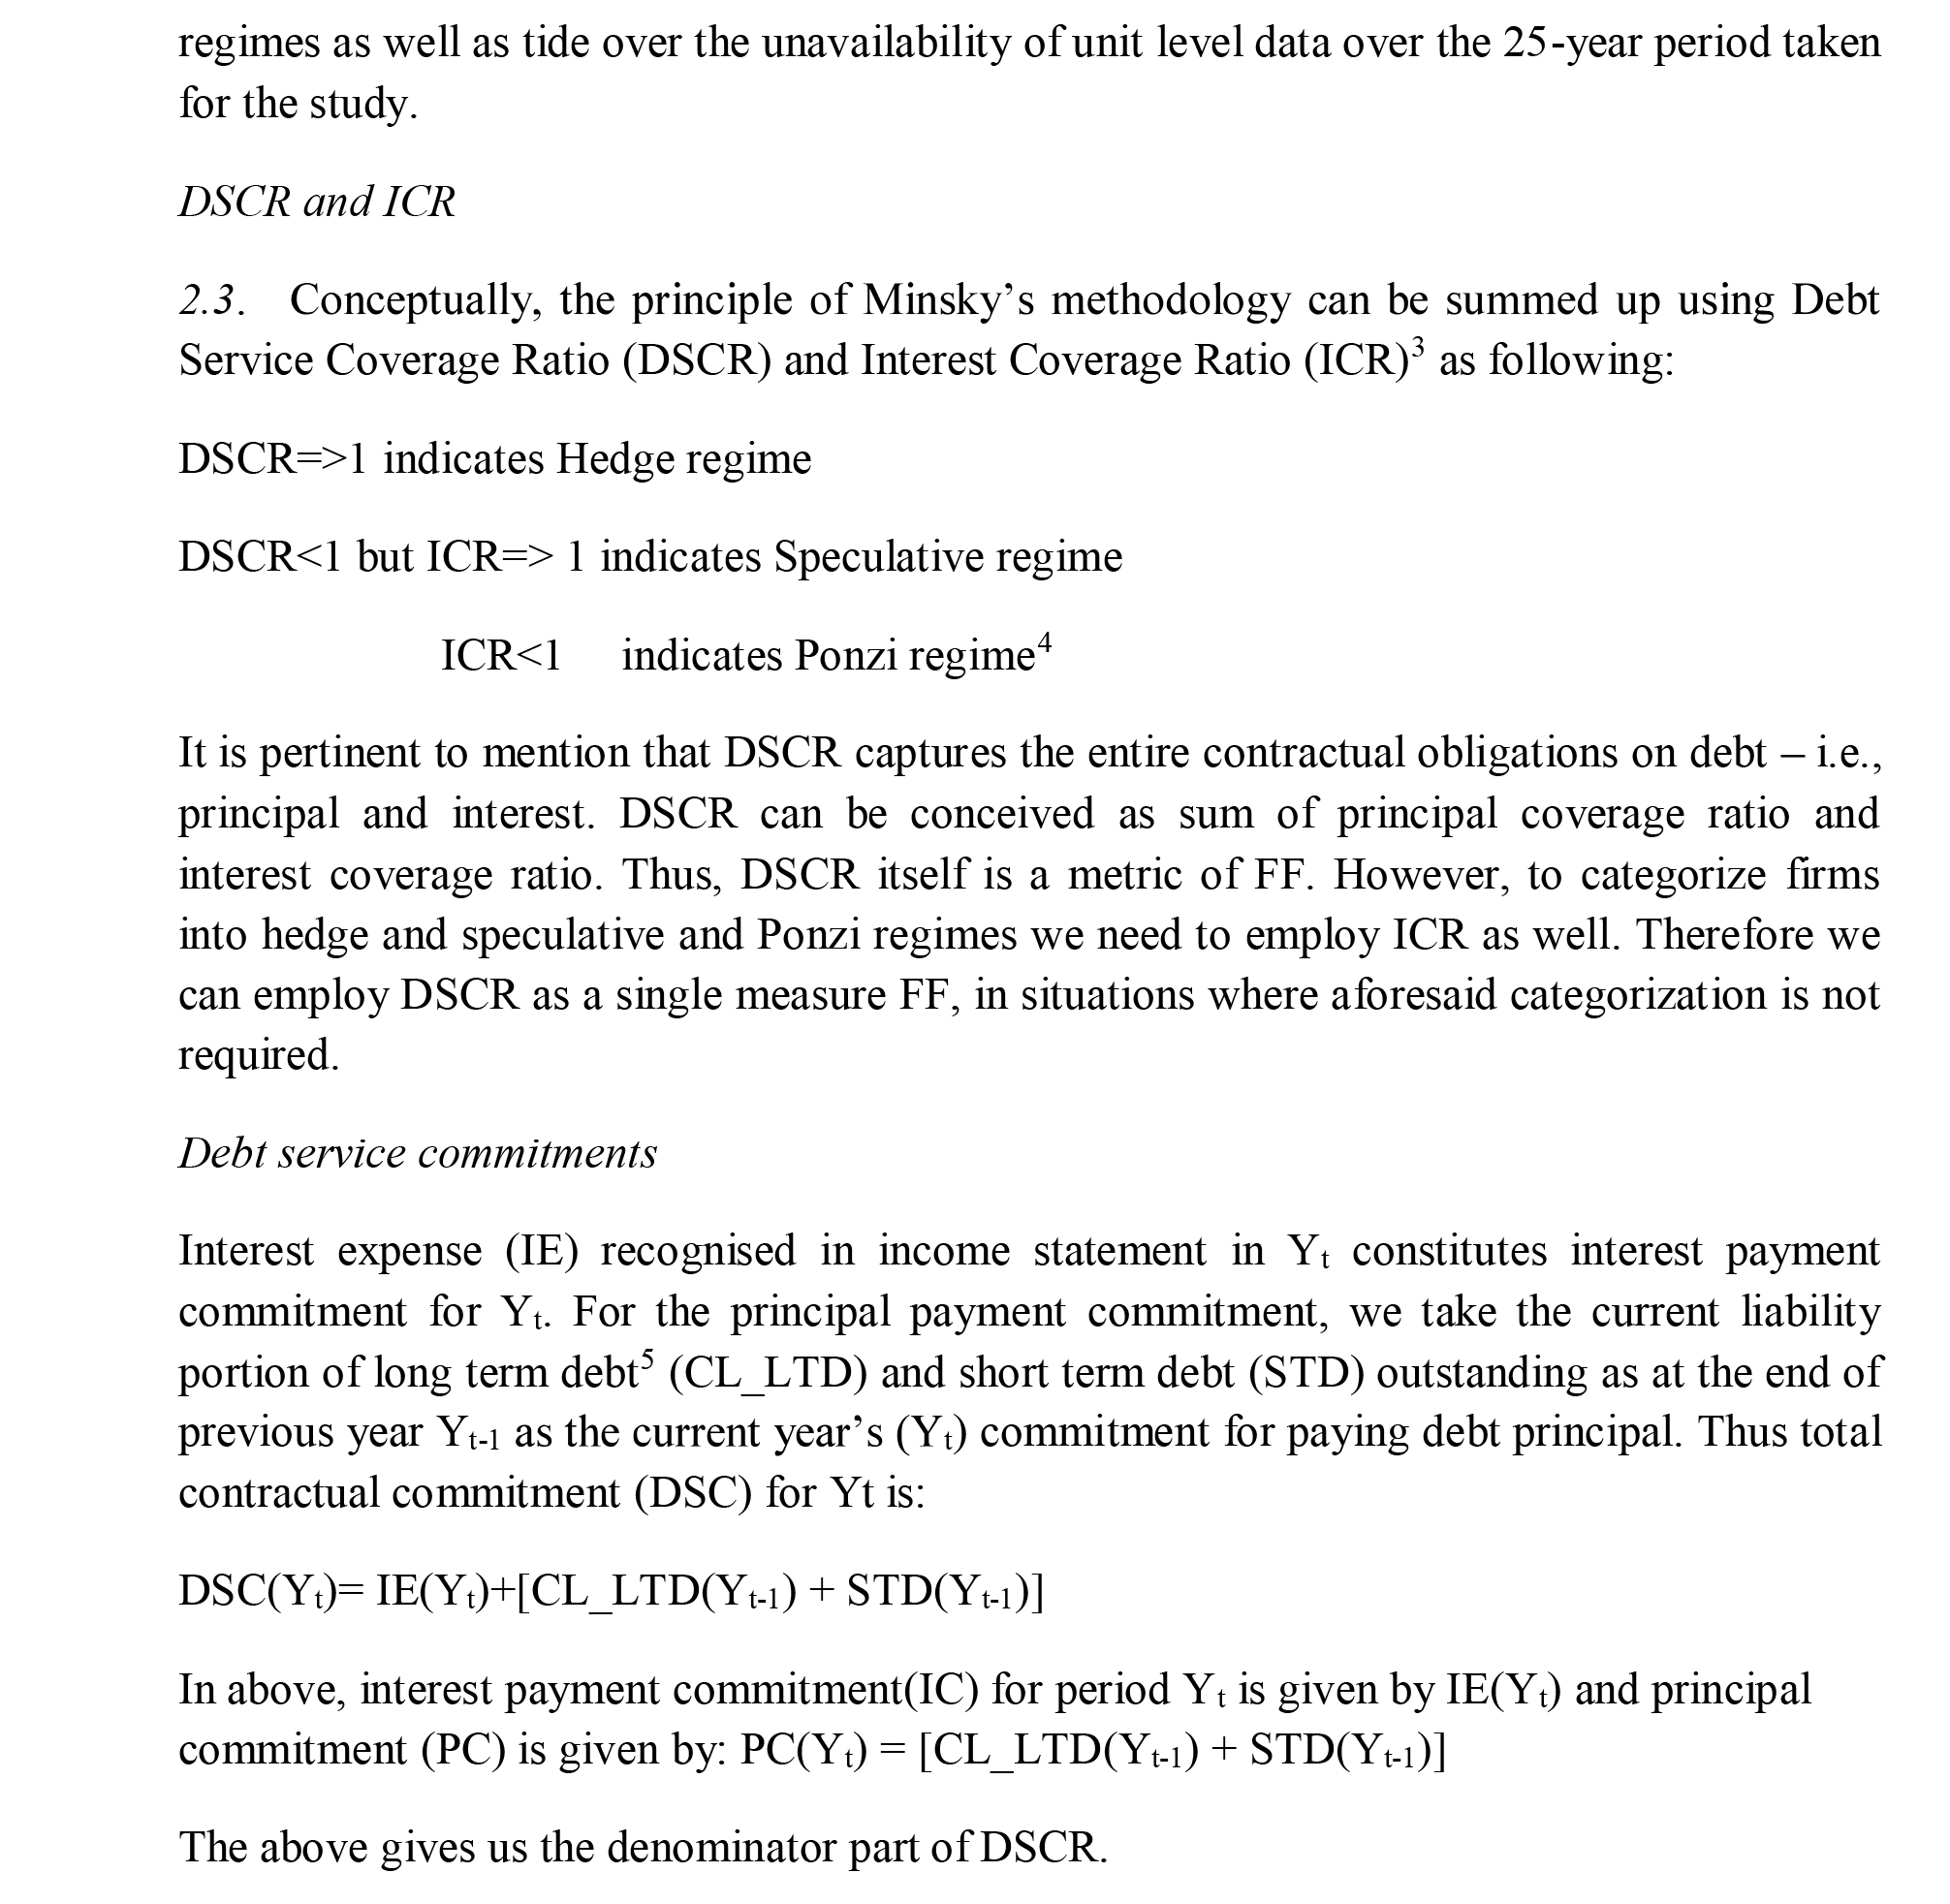
DSCR and ICR
2.3. Conceptually, the principle of Minsky's methodology can be summed up using Debt Service Coverage Ratio (DSCR) and Interest Coverage Ratio (ICR) as following:
One difficulty with the above approach is that data for short term borrowing and current maturities of long term borrowing is available from 2010-11 only , giving us only seven yearly data points (since short term borrowing and current maturities of long term borrowing outstanding as the end of year 2010-11 fall due in 2011-12). Therefore, commitment for payment of principal is zero from 1994-95 to 2009-10. This has the effect of underestimating FF during this period. To overcome the problem of missing data, we refer to cash flow statements where continuous data is available from 1994-95. We use the yearly item “repayment of borrowing” from cash flow statements as proxy for yearly debt repayment obligations. This item represents actual cash outflow and will not capture the debt payment obligations of a borrower who chooses to default. Therefore, the inclusion of the proxymay still somewhat underestimate the principal repayment commitments. However, given the limitation of data, this seems to be the best approach.
Capacity to meet debt service commitments
We estimate the capacity for payment in two ways: One, fromthe usual accrual based Income statement we pick up PBDITA for each year. In the second approach we pick up “cash from operations” (OPCASH)to represent payment capacity. It is pertinent that cash flow statement is not subject to the assumptions and adjustments, unlike accrual based accounts. As debt service payments involve cash outflows, OPCASH is a more precise measure of capacity to pay. PBDITA, on the other hand, includes all incomes expected to be received and expenses expected to be paid in the given period; hence conceptually more sound and stable. By its very nature, OPCASH based FF may show more volatility. In the 125 data points of five sectors of Real Estate & Construction Industry (25 yearly data points from 5 sub-sectors) there are just six instances where OPCASH is more than PBDITA. Would the OPCASH underestimate FF? Or would PBDITA overestimate FF? We don't have definitive answers. Taking cognisance of above pros and cons, we estimate DSCR and FF using both the approaches.
Cash from operations exclude interest income. In Indian context,borrowed funds are often channelized into group entities as intra-group loans, for which the lending company receives interest. These group entities typically carry out some of the activities of the main company on outsourcing basis. We feel that by excluding interest income, we risk systematically underestimating payment capacity of the companies. Therefore, to arrive at realistic payment capacity we have added interest received to OPCASH to get OPCASH(Adjusted). It may be mentioned that PBDITA does not suffer from this defect as it includes interest income, while excluding interest expense.
FF Index
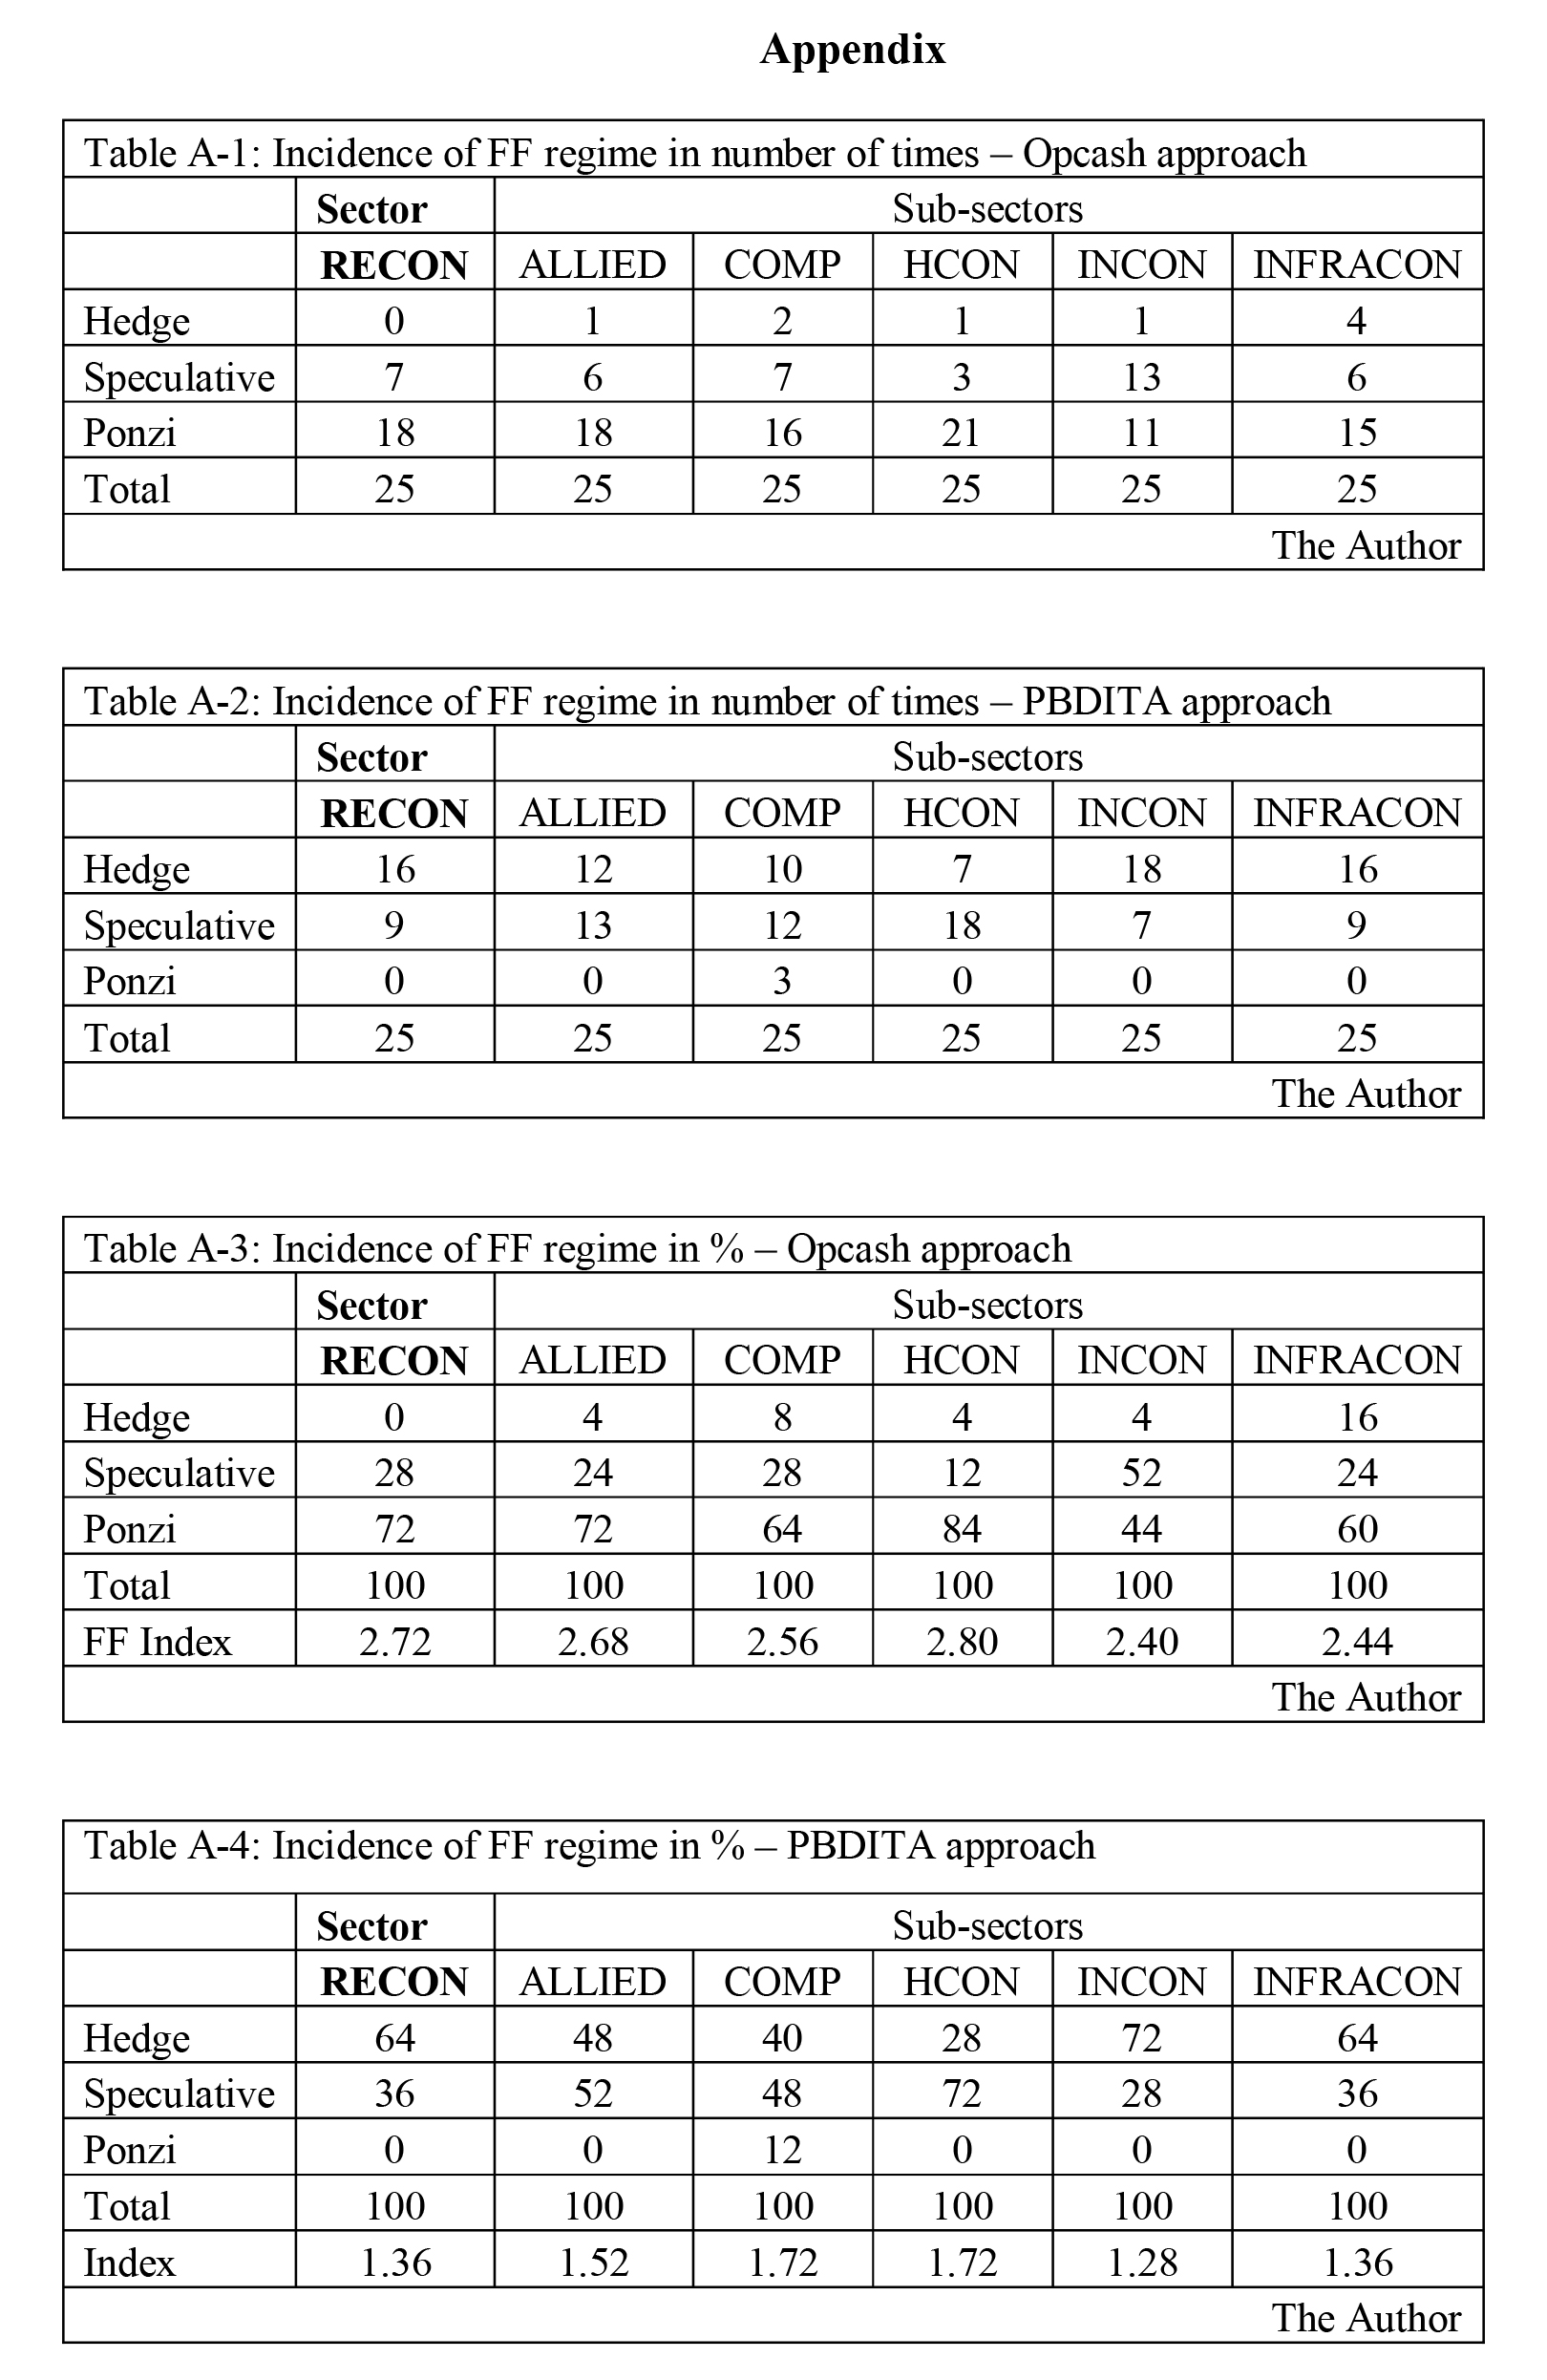
We devise a simple financial fragility index. FF Index is a weighted average of FF over 25 years in consideration. For this, we first calculate the % incidence of each FF regime as below:
% incidence =Number of times Hedge or Speculative or Ponzi / 25*100
We assign weights of 1, 2 and 3 to Hedge, Speculative and Ponzi regimes respectively and computeFF Index = Hedge %*1 + Speculative %*2 + Ponzi%*3. The resultant Index is continuous number denoting FF in increasing scale. FFI of 1 denotes Hedge while FFI of 3 denotes Ponzi.
FF and the level of debt and debt to income ratio
From the above analysis we also get DSCR for 25 years for each of the 5 subsectors. We calculate debt ratio (debt to total assets ratio)and debt to income ratio (debt to total income) of each subsector. For the purpose we define, Debt = Total Assets - Net worth. Total income is picked up from Income statement.
Wetabulate the results in Appendix(except the regression result, which is reported in Results section). This is followed by a discussion of the results.
3. Results
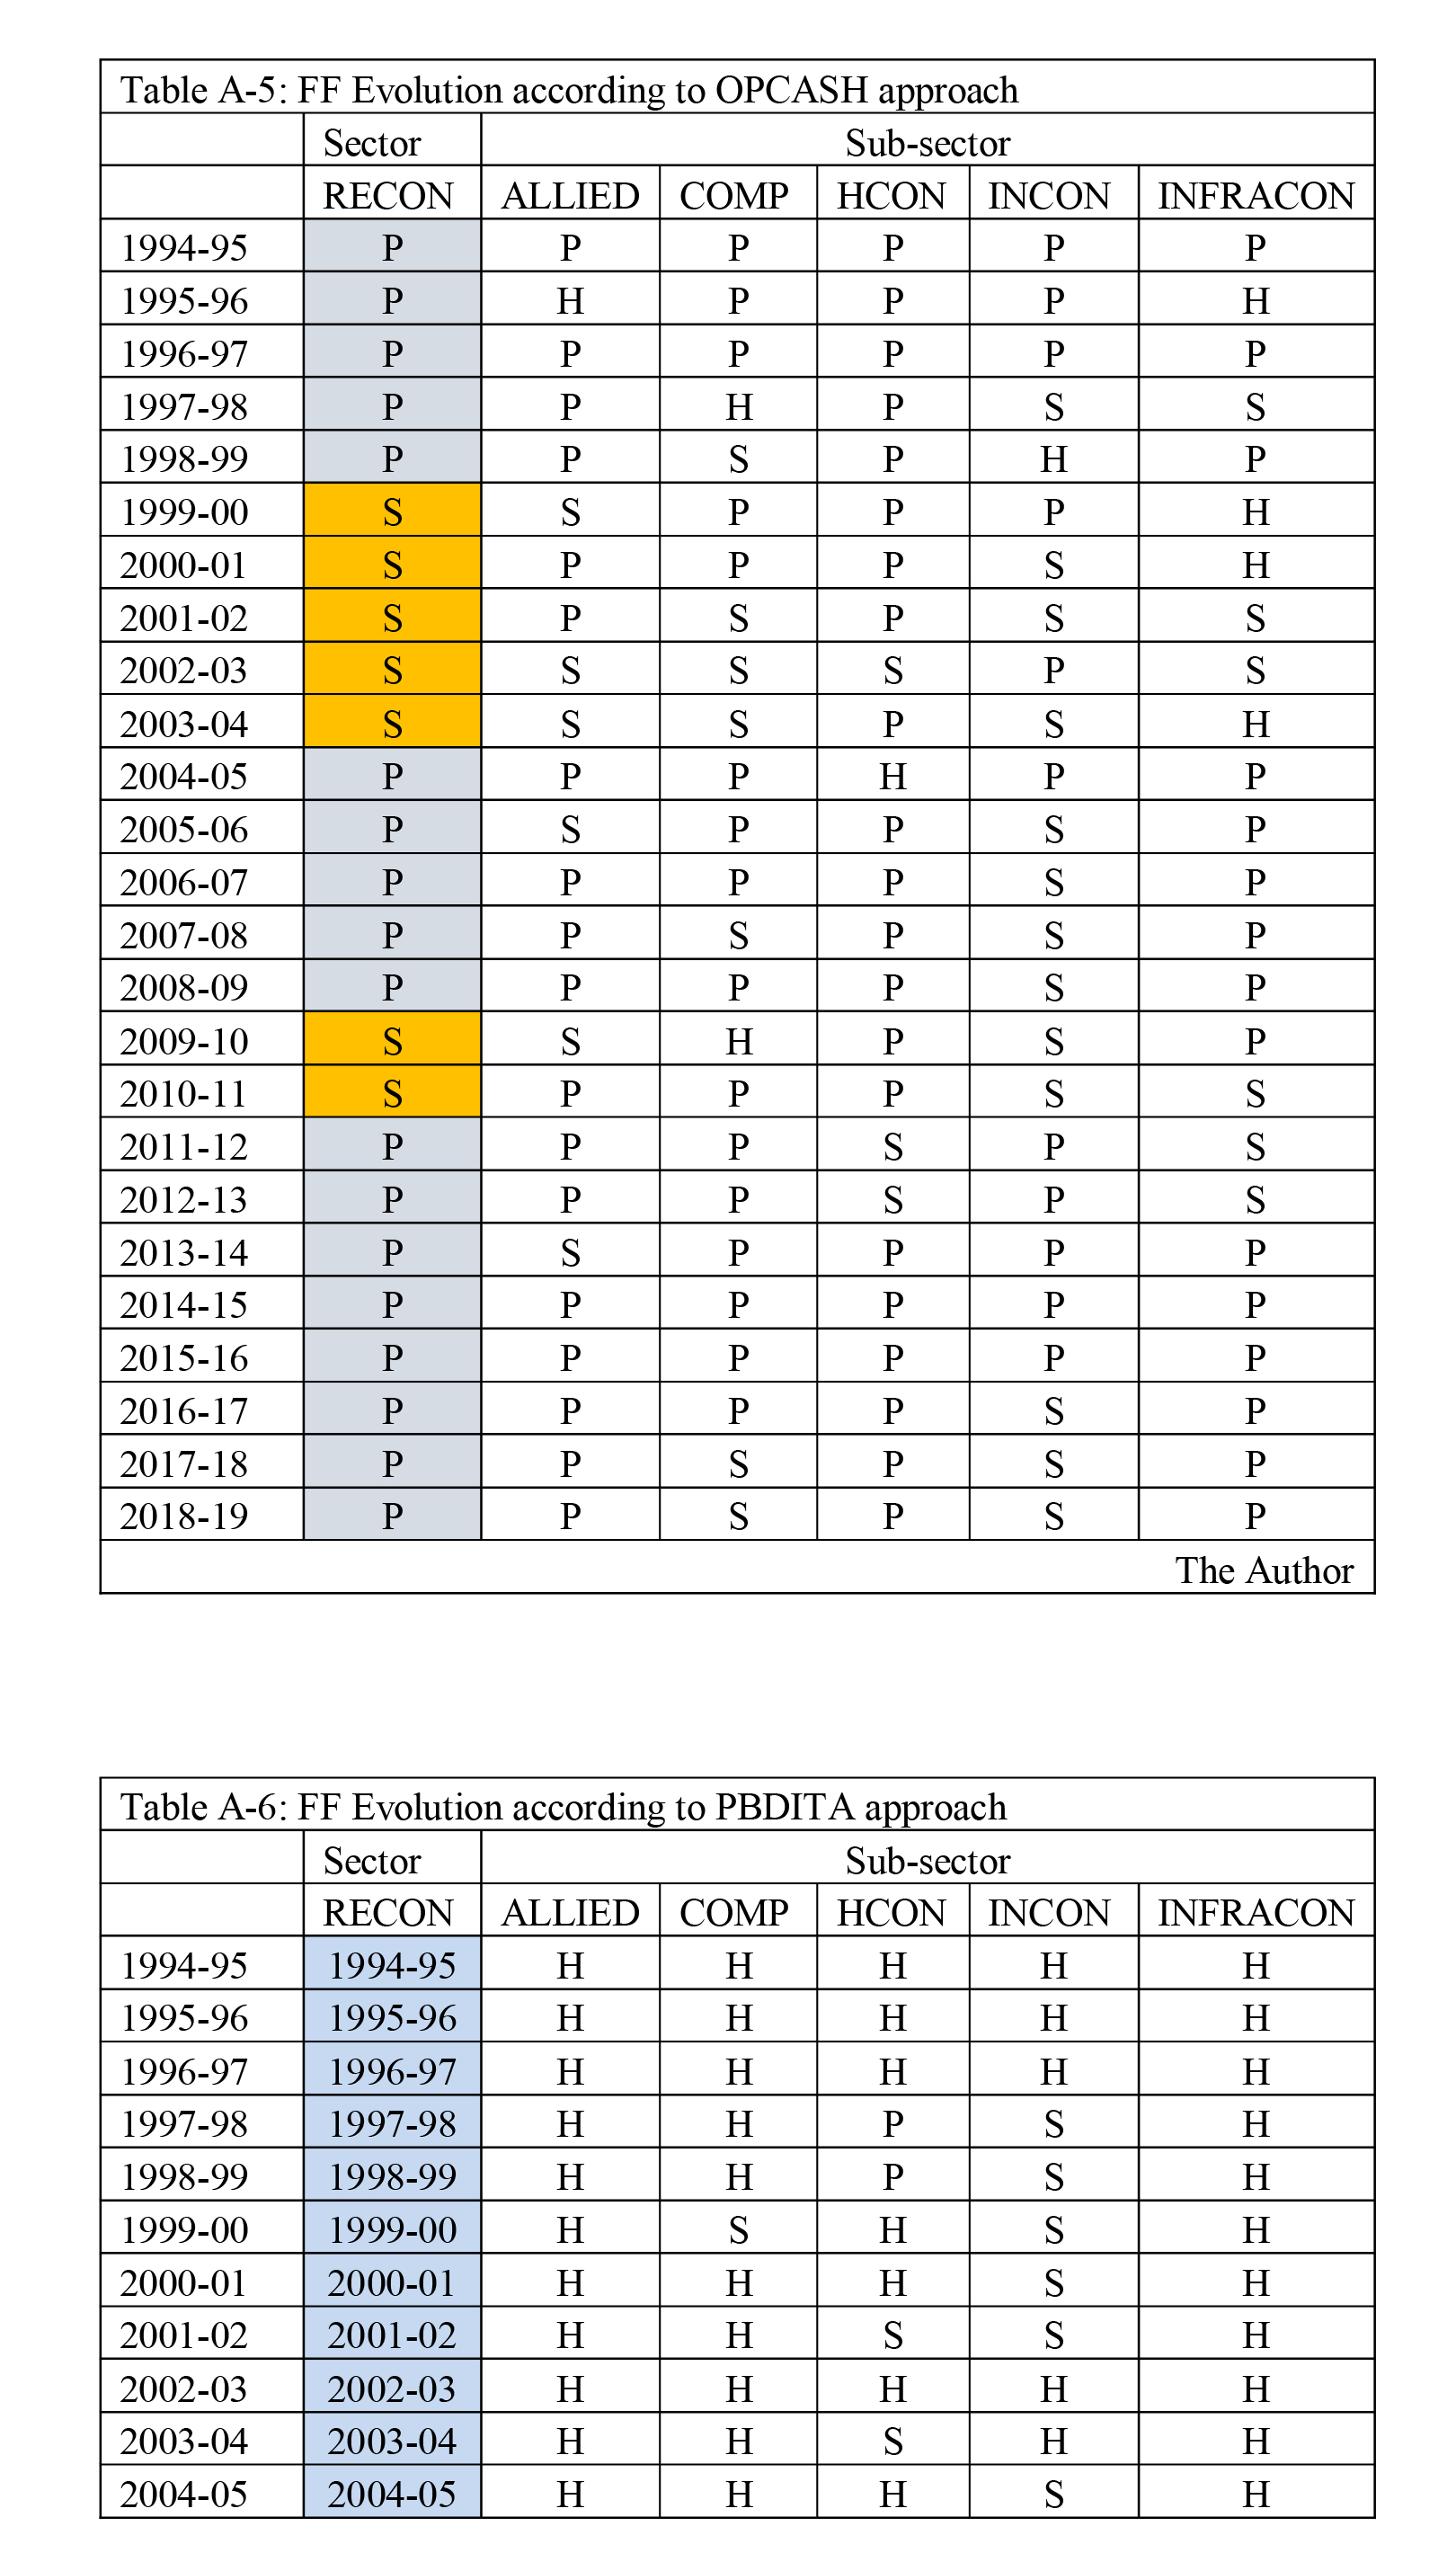
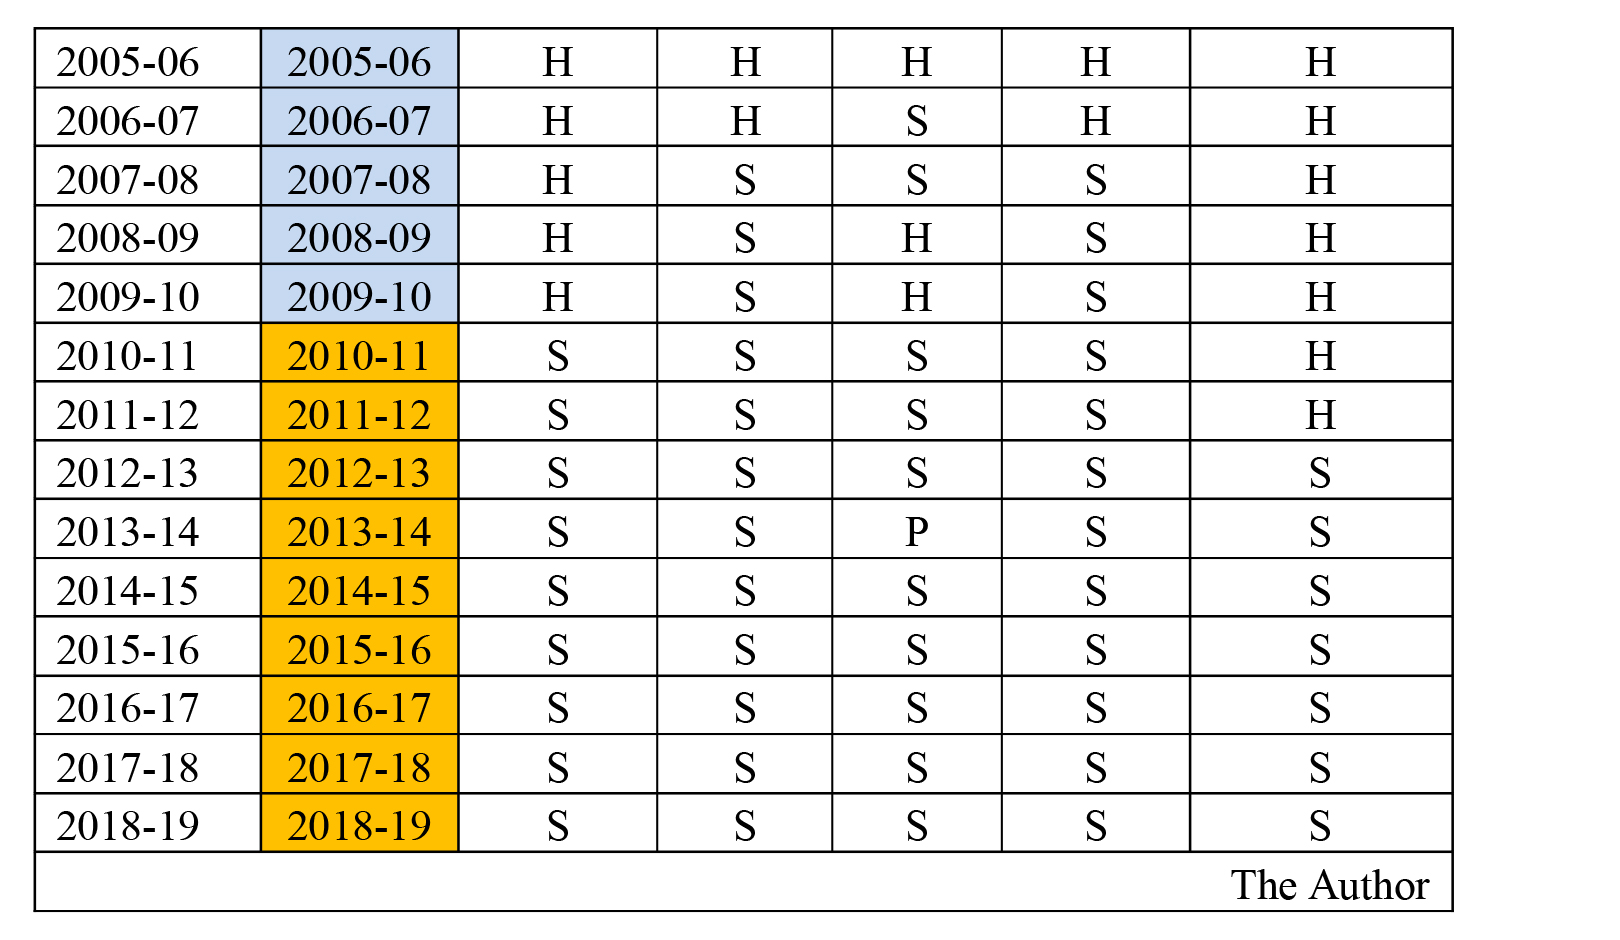
3.1 Evolution of financial fragility
We observe that there is significant difference in FF estimated by the OPCASH and PBDITA approaches. According to OPCASH approach, except for the period 1999-2000 to 2003-04 and 2009-10 to 2010-11, the sector was in Ponzi zone for all the years. During the above periods, the sector was in Speculative territory. However, according to PBDITA approach, the sector was Hedge from 1994-95 to 2009-10. From 2009-10 the sector deteriorated to Speculative and further declining to Ponzi in 2011-12 all the way to 2018-19. According to OPCASH approach, the sector was Ponzi in 18 of 25 years (72%) and Speculative in 7 of 25 years (28%). According to PBDITA approach the sector was Hedge in 16 years (64%) and speculative in 9 years (36%).Likewise FF Index for the sector 2.72 (close to Ponzi) as per OPCASH approach and 1.36 (close to Hedge) as per PBDITA approach. As per OPCASH approach, the subsectors ranked in the order of FF Index were HCON, ALLIED, COMP, INFRACON and INCON. Thus HCON was most fragile while INCON was the least.As per PBDITA approach, both HCON and COMP have the same FF Index, ranking highest in terms of FF index, followed by ALLIED, INCON, INFRACON. The ranking of the subsectors in terms of FF Index broadly converges in two approaches.
Discussion of the results
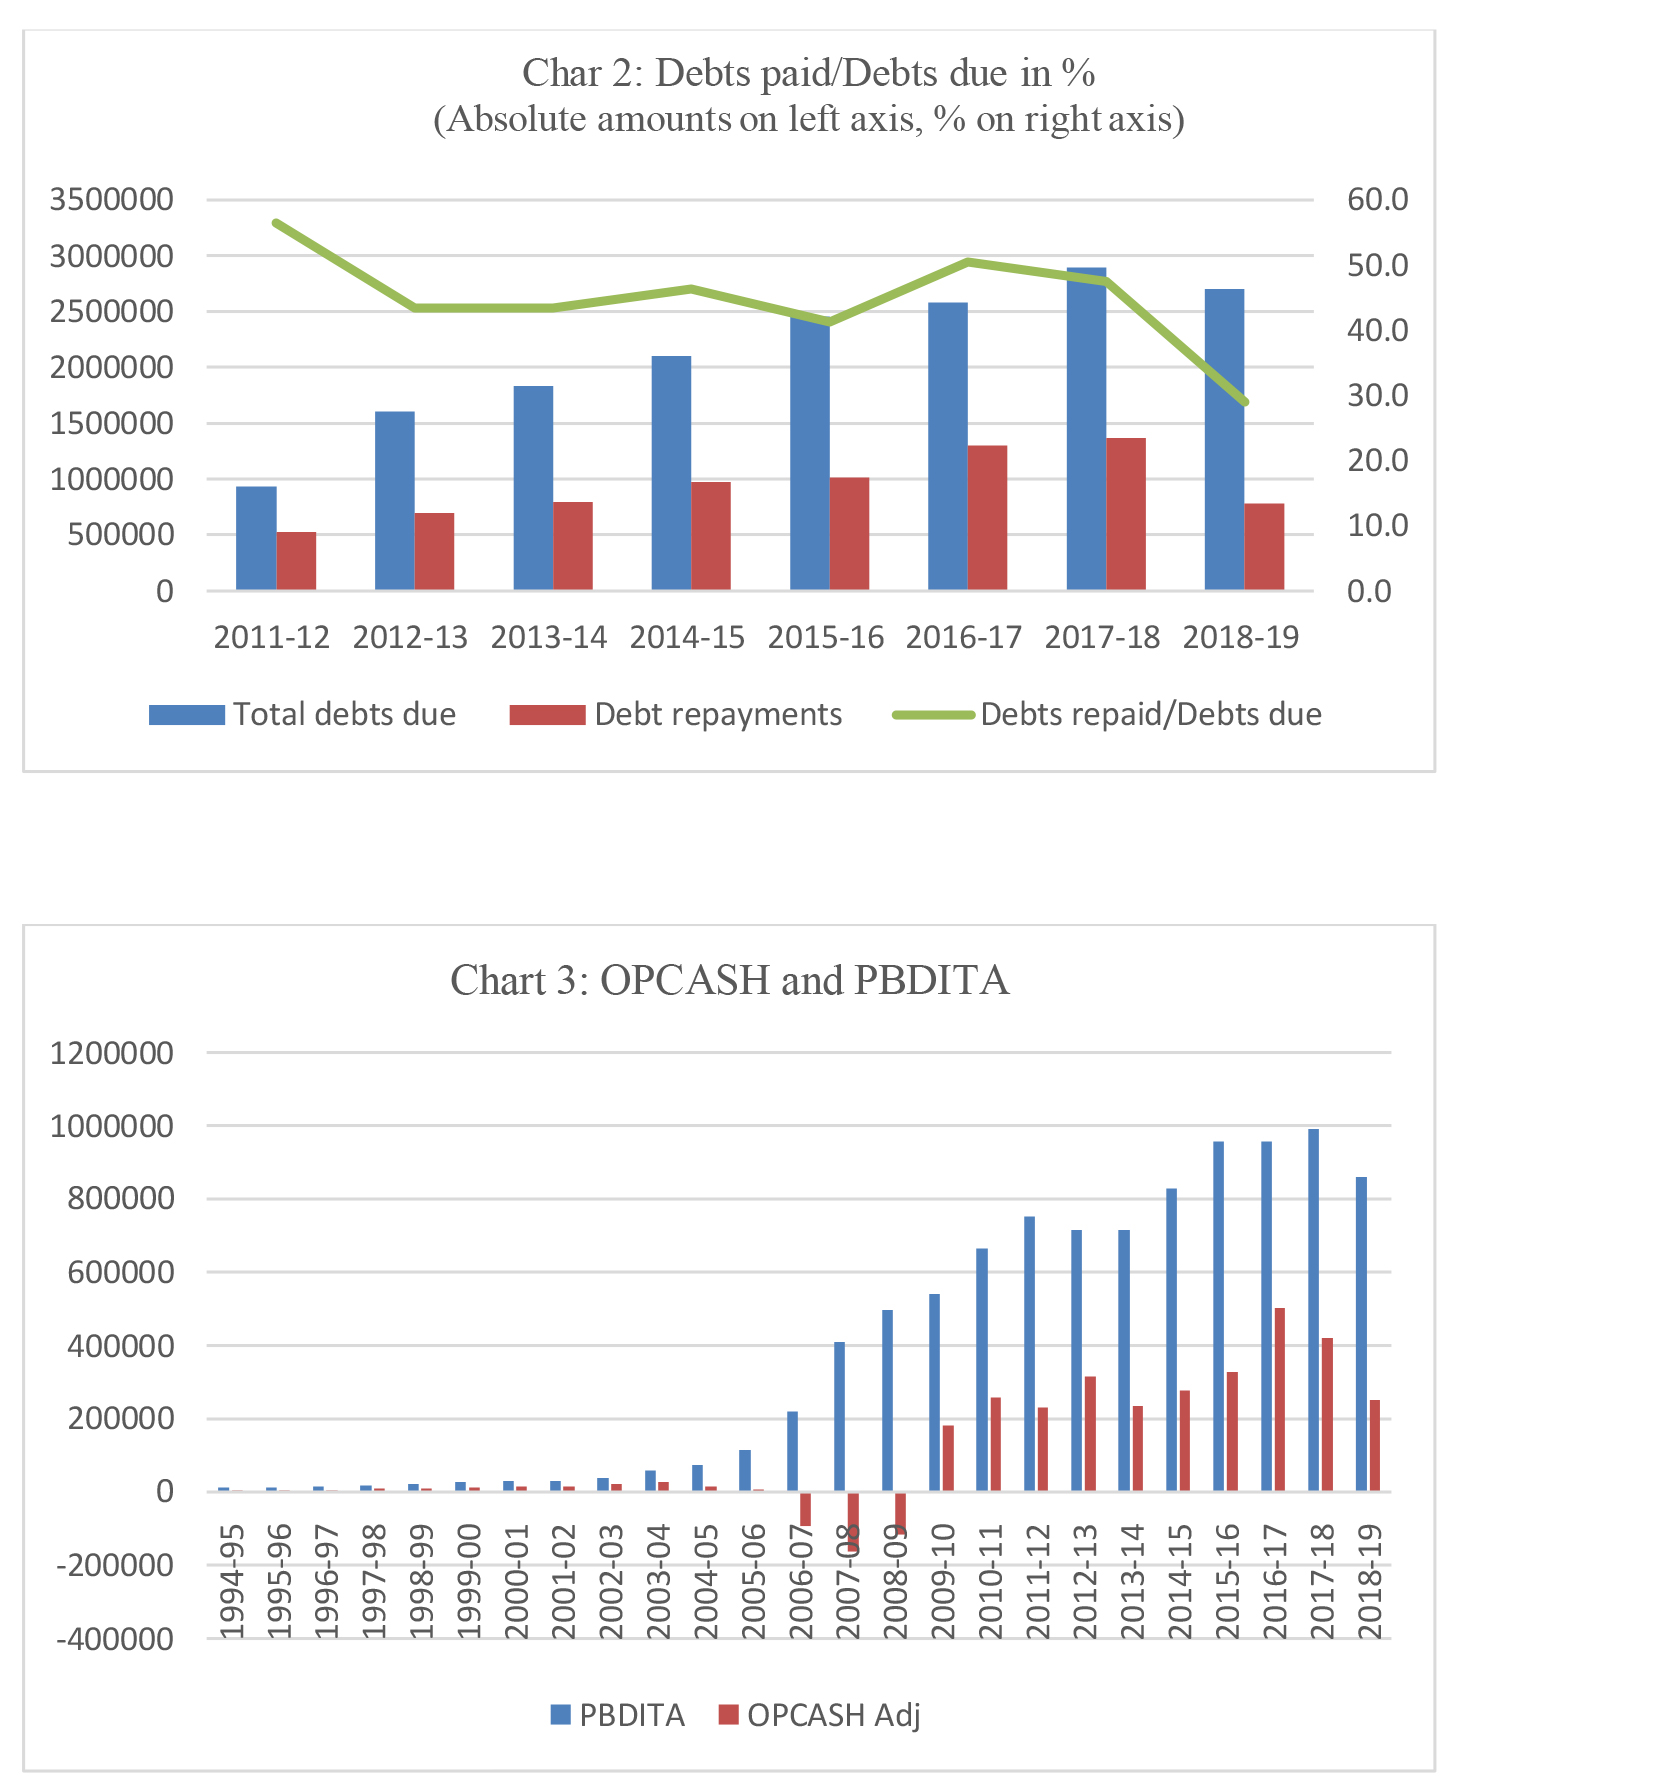
Given the divergent pictures portrayed by the two approaches, the question is which of these approaches is correct. For resolving this issue, we try to get some corroborative evidence. FF is essentially ability to pay interest and principal that fall due for payment. Interest expense recognized in Income account for a year (Yt) is the amount of interest that fell due for payment in that year. We compare this with interest actually paid in that year, as picked up from cash flow statement. Similarly, toestimate the amount of principal repayment due in a year we take outstanding short-term debt and current maturities of long term debt as at the end of previous year(Yt-1) ; and compare with actual repayment of loans made in Yt, as picked up from the cash flow statement. As stated before, this data is available only from 2011-12.We have to bear in mind that payment of interest or debt may relate to dues of earlier periods and not necessarily of Yt, which is also indicative financial stress. We also have to bear in mind that non-payment of dues may also be deliberate and not necessarily linked to capacity.We chart the results as below (Chart 1).
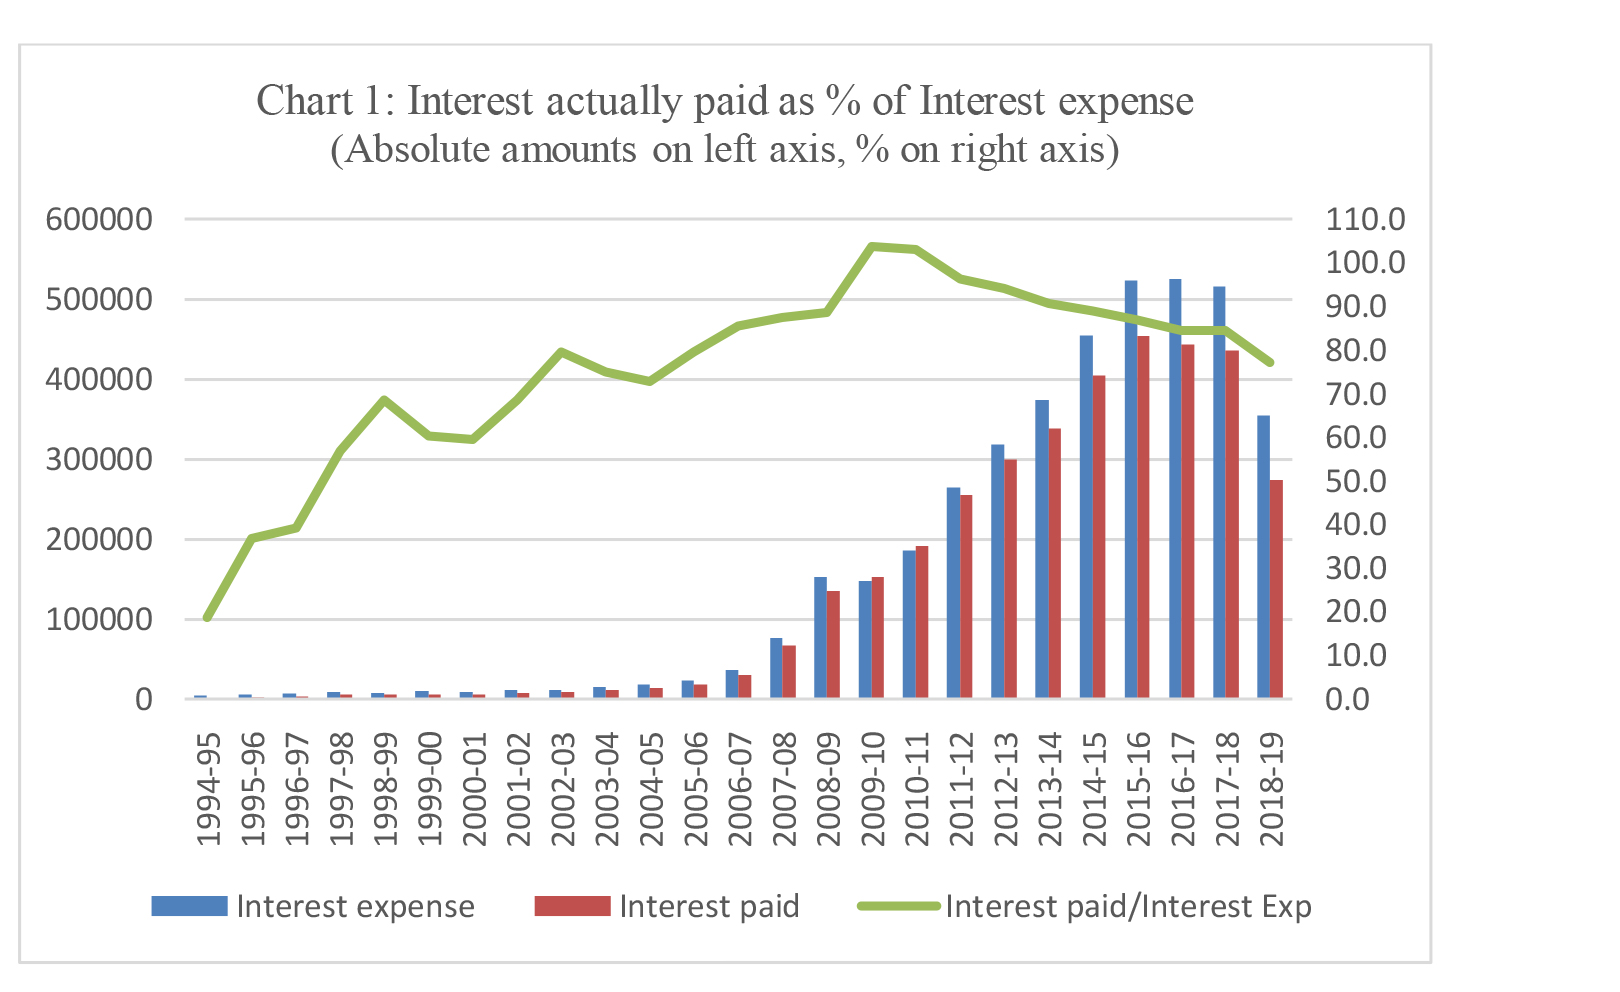
Only in the years 2009-10 to 2013-14 actual payment of interest was 90% or more of interest due, which suggest that for other years the sector was likely Ponzi. Likewise, actual repayment of principal as % of principal payments falling due was at its highest in 2011-12 then falling to just 29% in 2018-19 (Chart 2).The above indicates that FF assessed on the basis on OPCASH is more credible. The divergence in the two assessments arises from the fact that OPCASH is much lower than PBDITA for all the years (Chart 3). On average, OPCASH has been just 29% of PBDITA.
What is responsible for FF - level of debt or debt to income ratio?
To evaluate the association between FF and debt we examine DSCR in the context of two variables - (a) level of debt in the balance sheet - debt to total asset ratio, referred to as “debt ratio” and (b) level of debt in relation to income - debt to income ratio. We run a linear regression on MS Excelwith the following specification: DSCR = a+ b*Debt Ratio + c*Debt to Income ratio. We do this for both OPCASH and PBDITA approaches. The results are tabulated below.
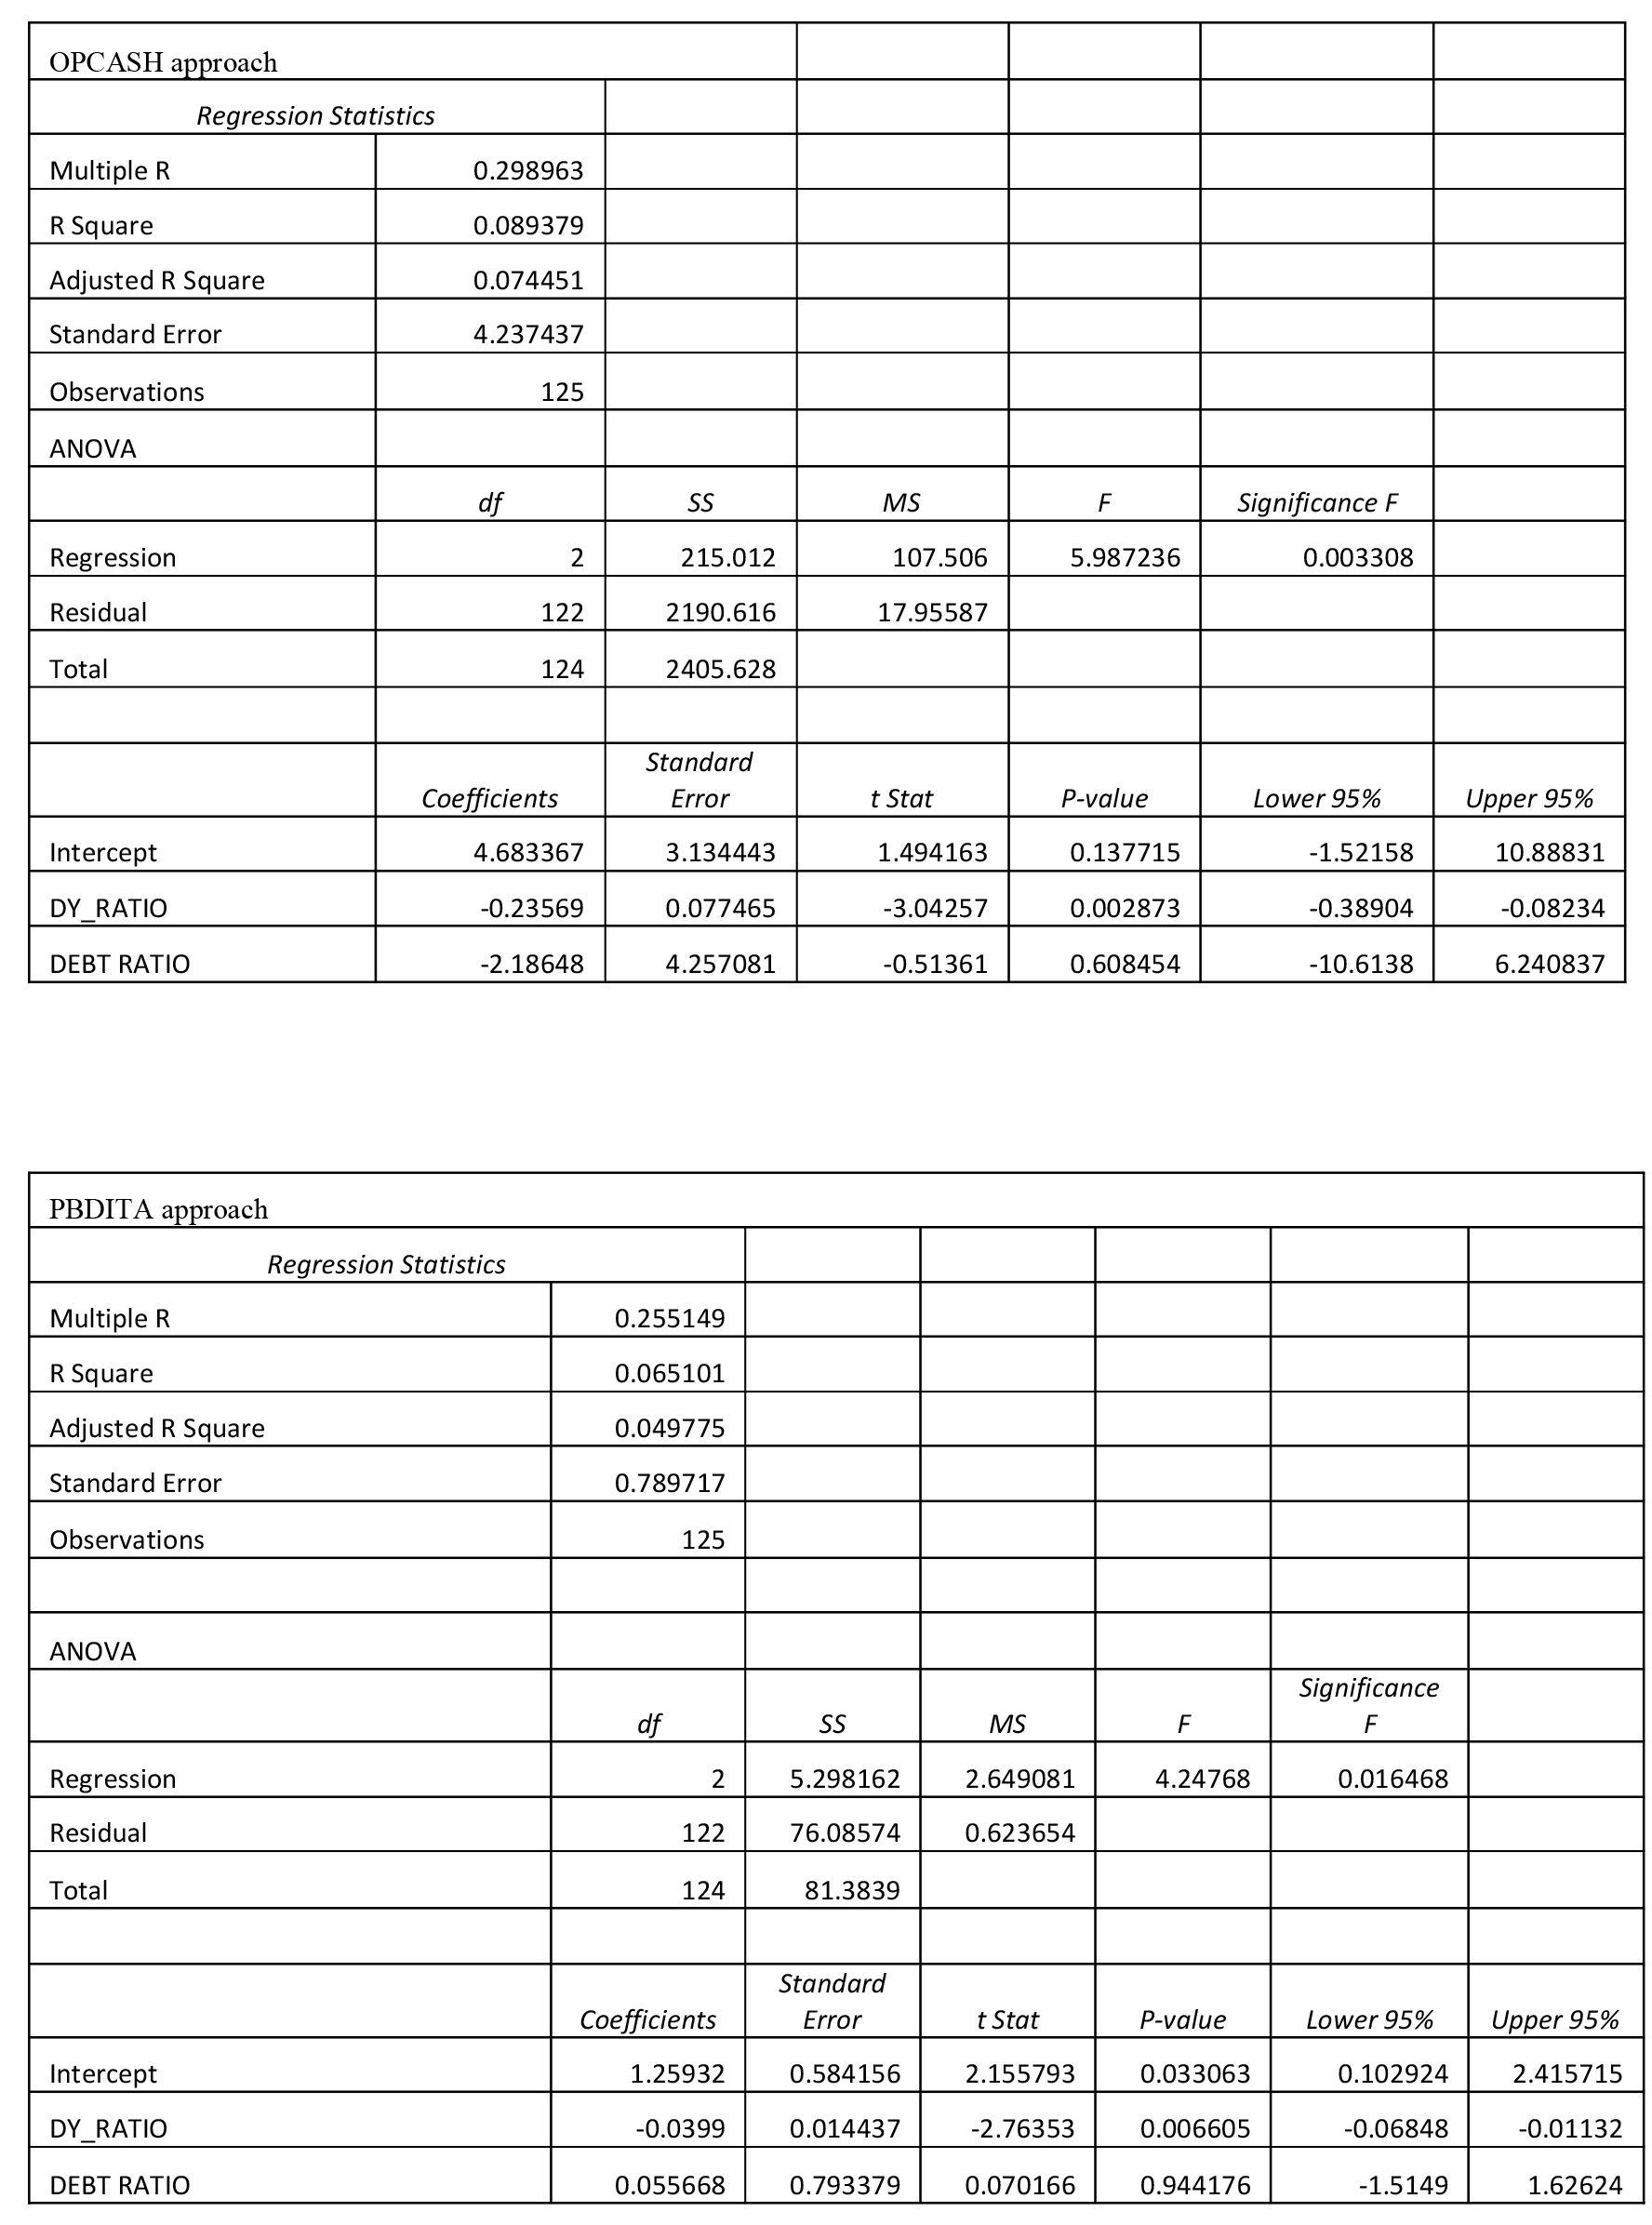
In OPCASH approach both debt ratio and debt to income ratio have negative coefficients, as expected. However, the coefficient of debt ratio is not significant. In the PBDITA approach, debt to income ratio has a negative coefficient and is significant. However, debt ratio has a positive coefficient (which is counterintuitive) but is not significant.We therefore infer that debt to income ratio is negatively associated with DSCR.What the results signify is that share of debt in financing of the balance sheet does not determine FF. Instead, it is the level of debt in relation to the level of income that determines the capacity to service debt and accordingly FF. If debt is to be repaid, debt service has to be met from income. Thus the level of income validates the level of debt.
4. Concluding remarks
The aboveanalysis indicate that the RECON sector was financially fragile right since 1994-95. Regardless of the approach followed, the sector went into a deeper state of financial fragility from 2009-10 / 2010-11. Our study further shows that DSCR is negatively associated with debt to income ratio. This is consistent with Minsky's view that financial fragility arises when the level of debt is not validated by the level of income. The analysis also questions the validity of accrual accounting profit (PBDITA) as the same does not appear to be validated by “cash from operations” (OPCASH). More research is required to understand the reasons for systematically lower level of cash from operation vis-à-vis accounting profit.
References
Argitisa, Georgios, and Maria Nikolaidi (2013), "The financial fragility and the crisis of the Greek government." International Review of Applied Economics.
Bernanke, Ben, and Mark Gertler (1990), "Financial Fragility and Economic Performance." The Quarterly Journal of Economics (Oxford University Press) 87-114.
Bhaduri, Amit(2011), "A contribution to the theory of financial fragility and crisis." Cambridge Journal of Economics (Oxford University Press) (Vol. 35, No. 6): 995-1014.
Bhattacharya, Sudipto, Charles Goodhart, Dimitrios P Tsomocos, and Alexandrous P Vardoulakis (((2015), "A Reconsideration of Minsky's Financial Instability Hypothesis." Journal of Money, Credit and Banking (The Ohio State University) 47 (5): 931-973.
Charles, Sébastien (2016), "Is Minsky's financial instability hypothesis valid?" Cambridge Journal of Economics 40 (2): 427-436. https://doi.org/10.1093/cje/bev022.
Damodaran, Aswath (2014),Applied Corporate Finance. Vol. 4th Edition. Wiley. https://www.researchgate.net/publication/348666126_Corporate_Finance.
Davis, Leila E., Joao Paulo A. de deSouza, and Gonzalo Hernandez (2017), "An empirical analysis of Minsky regimes in the US economy." Economics Department Working Paper Series, University of Massachusetts Amherst (224).
Filho, Ernani Teixeira Torres, Norberto Montani Martins, and Caroline Yukari Miaguti(2017), "Minsky's Financial Fragility:An Empirical Analysis of Electricity Distribution Companies in Brazil (2007-15)." The Levy Economics Institute Working Paper Collection (Levy Economics Institute) Working Paper No. 896.
Ghosh, Saibal(2006), "Does leverage influence banks' non-performing loans? Evidence from India." Applied Economics Letters (Taylor & Francis) 12 (15): 913-918.
Keen, Steve (1995), "Modeling Minsky's "Financial Instability Hypothesis"." Journal of Post Keynesian Economics (Taylor & Francis, Ltd.) 7 (14): 607-635.
Lavoie, Marc (1986-87), "Systemic Financial Fragility: A Simplified View." Journal of Post Keynesian Economics Vol. 9 (2): 258-266.
Lima, Antonio J. A. Meirelles, and Gilberto Tadeu (2006), "Debt, Financial Fragility, and Economic Growth: A Post Keynesian Macromodel." Journal of Post Keynesian Economics (Taylor & Francis, Ltd.) Vol. 29, (1): pp. 93-115.
Minsky, Hyman (1977); also see revised Levy Institute edition 1992. "Financial Instability Hypothesis, An Interpretation of Keynes and an alternative to "Standard" Theory." Nebraska Journal of Economics and Business, © 1977 Creighton University 5-16.
Minsky, Hyman (2008),Stabilizing and Unstable Economy. McGraw-Hill .
Minsky, Hyman (1986),Stabilizing an Unstable Economy. Levy Economics Institute.
Mulligan, Robert (2013), "A sectoral analysis of the financial instability hypothesis." The Quarterly Review of Economics and Finance 53 (4): 450-459.
Mulligan, Robert, Roger Lirely, and David Coffee (2014), "An Empirical Examination of Minsky's Financial Instability Hypothesis: From Market Process to Austrian Business Cycle." Journal des Économistes et des Études Humaines 20 (1-17).
Nishi, Hiroshi (2016), "An empirical contribution to Minsky's financial fragility; Evidence from non-financial sectors in Japan." Kyoto University,Graduate School of Economics, Discussion Paper Series (Discussion Paper No. E-16-007).
Palley, Thomas (1994), "Debt, Aggregate Demand, and the Business Cycle: An Analysis in the Spirit of Kaldor." Journal of Post Keynesian Economics (Taylor & Francis, Ltd.) 371-390.
Rozmainsky, Ivan, and Sergey Beshenov(2015), "Hyman Minsky's financial instability hypothesis and the Greek debt crisis." Russian Journal of Economics 1 (20).
Sen, Kunal, Sabyasachi Kar, and Jagdish Prasad Sahu (2014), "The political economy of economic growth in India, 1993 to 2013." ESID Working Paper (Effective States and Inclusive Development Research Centre (ESID), School of Environment and Development, The University of Manchester) (44).
Wray, L. Randall, and Éric Tymoigne (2008), "Macroeconomics meets Hyman P. Minsky; the financial theory of investment." Working Paper, Levy Economics Institute of Bard College (543).