Subscribe now to get notified about IU Jharkhand journal updates!
Multidimensional Analysis Of Poverty In Tripura
Abstract :
Measurement of poverty has always gone through serious difficulties and dilemma in India. Time and again, the methodology adopted for measuring poverty has been subjected to serious scrutiny for modification and restructuring. The Planning Commission, of India has always relied on the Money Metric or income/consumption approach, but it will be a great methodological error if poverty is considered simply as an economic problem. The present study seeks to apply and the Multidimensional approach to find out the severity and incidence of poverty in Tripura. The primary data analysis confirms incidence of multidimensional poverty in Tripura with greater severity in rural areas. Comparison between two districts shows that severity of poverty is higher in Dhalai district. It is observed that along with household level measures the proper functioning of government schemes and programmes are necessary to control and alleviate poverty.
Keywords :
Money Metric Poverty, Multidimensional Poverty, Fuzzy SetJEL Code: I3, I32
1. Introduction
Measurement of poverty has continually gone through serious complications and dilemma in India. Time and again, the procedure adopted for measuring poverty has been subjected to serious scrutiny for modification and restructuring. The Planning Commission, of India has always relied on the Money Metric or income/consumption approach which is also known as Uni-dimensional approach. The assessment technique of poverty in India is based upon two different components:-
Firstly, Information regarding consumption expenditure and its distribution across households is provided by the NSS (National Sample Survey) consumption expenditure surveys. Secondly, Expenditures by households are evaluated with reference to a given critical value considered as poverty line and the households with consumption expenditure below this are considered as poor. But it will be a great methodological error if poverty is considered simply as an economic problem. It is also a trap of economic, political, institutional, ethnic, and class-related connections with its persistent historical roots. The well being of a person can be seen in terms of the wellness of his/her being. Living can also be viewed as a set of interrelated ‘functioning’, consisting of beings and doings. A person’s achievement in this respect can be seen as the vector of his or her functioning like being in good health, being happy and taking part in life of the community etc. Again, directly connected to the concept of functioning is the capability to function that a person can attain. Therefore, capability as a set of vector determines a person’s freedom to lead a particular standard of life. But there is no doubt that it is the problem of poverty that constrains a person’s freedom. The Oxford Poverty Development Initiative (OPHI) has developed a new international measure of poverty- the Multidimensional Poverty Index or MPI- for the 20th Anniversary edition of the United Nations Development Programme’s flagship Human Development Report. This MPI goes beyond a traditional focus on income and consumption expenditure (which is popularly called the Money Metric approach to poverty) to define poverty reflecting the multiple deprivations that a poor person faces with respect to education, health and living standard. In this new approach to poverty, even the concept ‘living standard’ is not defined in money terms. The present study seeks to apply both the Money Metric approach and the Multidimensional approach to find out the severity and incidence of poverty in Tripura which is socioeconomically a backward and geographically an isolated state of Northeast region of India. The methodology adopted by the Planning Commission, GOI is essentially based upon the Money Metric approach to poverty and since such a narrow base approach sees Tripura in poor light so far as poverty is concerned, it will be interesting to investigate the level of deprivation of the people of Tripura by applying a broad base Multidimensional approach to poverty.
1.1.Objectives
The following are the objectives of the present study:
- To measure poverty, rural-urban and district wise, by applying Multidimensional method of analysis.
- To analyse the extent of poverty in different dimensions of Multidimensional poverty.
1.2.Importance of the study
There have been a plethora of theoretical debates regarding the issues of how measurement of poverty should be performed. Traditional measures of poverty, for instance, the headcount ratio or poverty gap index emphases completely on a money-metric, i.e., income centred evaluation of the phenomenon. As income relates to welfare, captured by the utility function in standard economics, this is undeniably an intuitive approach. Due to the reason that such data is easily attainable and at the same time due to the quality of easy adequacy it is found that in most of the empirical studies and policy decisions it is regarded that a rise in income as an sign of an increase in welfare. But applying income as the solitary indicator is not a suitable measurement of poverty for the reason that income is just one of many variables determining inclusive utility. Thus, income based methods are necessary but not sufficient indicators of poverty. In this connection the present research tries to measure incidence of poverty by applying traditional money metric approach and more advanced multidimensional approach. At the same time it bears ample importance to examine the level of deprivation of different attributes that encourages poverty at household level.
2. Review of literature
The present chapter reviews the empirical findings of some of the studies related to poverty, its problems and prospectus. Major concerns that has come into view from empirical studies on poverty concern defining and measuring poverty, extent of shift and factors affecting it, its spatial distribution, inconsistency between official poverty estimates and other estimates, and finally an evaluation of the performance of poverty alleviation programmes.
Sundaram and Tendulkar (2003) have found that poverty dropped during the period 1994-2000. They have examined rural and urban poverty separately for 15 states. For the requirement of comparison they have resolved the problem of comparability of monthly per capita expenditure in 50th (1993-94) round based on URP (uniform reference period) and 55th (1999-2000) round based on MRP (mixed reference period) by re-computing the data of 50th round on the basis of MRP (mixed reference period). While measuring changes in poverty over 1990s at the state-level, the authors have considered the headcount ratio (HCR), i.e. size of the poor population, the poverty gap index (PGI) i.e. the depth of poverty and finally the squared poverty gap (FGT) i.e. the severity of poverty. The study has found that poverty increased over the six years from 1993-94 to 1999- 2000 in Assam, Madhya Pradesh and Orissa. Assam recorded rise in poverty in terms of HCR, PGI and FGT. Madhya Pradesh showed a rise in HCR, and a decline in PGI and FGT. Orissa registered a decline in HCR, and rise in PGI and FGT. In the residual 12 states, a decline in poverty ratio has been observed. The weighted average of PGI on MRP (mixed reference period) of 15 states declined from 0.0933 to 0.0653 and FGT declined from 0.0308 to 0.0202. The bottom line that the study provides witness on is that despite diversity across the states, poverty declined in 1990s.
Himanshu (2007) on the basis of his study possess the view that poverty did decline during 1993-2005, but the annual rate of reduction during this period had been lower than how it has been in 1970s and 1980s. The study provides the confirmation that the earlier findings that the 1990s has indeed been the decade for poverty reduction. In this study, a tiny reduction in poverty has been observed in 1993-2000. It is also observed that the bulk of decline in poverty has occurred in 1999-2005. Poverty has declined faster during 1999-2005 but the annual rate of decline has been lower than that of in the decade of 1983-1994. The image evolving from the poverty reduction during 1999-2005 shows that poverty reduction at national level was due to poverty reduction in the states with above national average poverty till 1999. Further, this empirical research shows evidence of improvements in non-income indicators during 1993-2005.
Ram et al.(2009) have examined the distribution of BPL cards. They analysed the possession of BPL cards on the basis of wealth index. This wealth index is constructed using key variables like consumer durables, water, sanitation facilities etc. It also includes individual items like motorcycle, scooter, car, tractor, television and refrigerator, landline telephone, mobile phone, type of house as well as size of land holdings. Their analysis has been presented at national level and at the state level. At national level, 27 per cent of households in India hold BPL cards which is close to Planning Commission estimates on poverty (2000). About two-fifth of poor and one-fifth of non-poor households possess BPL cards. Only 39 per cent of poor people hold BPL cards. Majority of poor do not have BPL cards. They further studied percentage distribution of household possessing BPL cards by social characteristics like education, caste system and habitation. Near about 7 per cent of household with high school and above education hold BPL cards. It is found that rural urban differences in possession of BPL cards by these characteristics are not significant. At state level, in economically weaker states like Orissa and Bihar, a higher proportion of non-poor households possess BPL cards. In Andhra Pradesh and Karnataka, the number of non-poor households having BPL cards is higher than the poor households. Even the households which have pucca houses with three or more rooms and having vehicles with the facilities like television, refrigerator and land holdings of more than five acres also possess BPL cards. It indicates that welfare schemes prepared for poor people are siphoned off to the non-poor also. So, focus should be on identification of poor to make poverty reduction successful. There is need to search methods to identify poor for welfare schemes rather than depending only on BPL cards.
Ali et al. (2010) have estimated the incidence, depth, severity of poverty to examine the relative poverty dynamics in Pakistan that measures the extent and magnitude of poverty by using the Household Integrated Economic Survey data for the period of 1998-99 to 2004-05 through drawing an arbitrary poverty line. Thy study uses 75 percent, 66 percent and 50 percent of mean consumption expenditure as relative deprivations and found that 41.38 percent population of the country was poor at 66 percent in 1998-99, whereas depth & severity was observed respectively 10.25 and 3.60 percent. In spite of decline of 4.31 percent at the national level relative poverty was still high (37.78 percent) during the period of study. The provincial profile of relative poverty indicates the improvement in Sindh and Baluchistan but worsened in Punjab whereas the inter-provincial view exposes the improvement in relative poverty at all the levels. The relative poverty dynamics for 1998-99 to 2004-05 shows 45.61 percent in Punjab indicating the worst situation, 44.41 percent in Sindh, 36.40 percent in NWFP (renamed as KPK) and 27.04 percent in Baluchistan. The study suggest two prong policy for each province while defining the absolute and relative poor separately and emphasize to address are relatively poor in money metric as well as non-money metric aspects of life like as education, health, etc.
Alkire and Santos (2010) through their study have presented a new multidimensional poverty index which involves the basic services and core human functioning’s. Using micro datasets of household survey for the 104 developing countries accounting the 78 percent population of the world the new methodology addresses the interconnection of deprivations of the poor people and consists of three dimensions health, education & standard of living. They proposed index that is the composition of ten indicators and most of them are directly related the Millennium Development Goals. Moreover, equal weight is given to each dimension as well as attributes to simplify the analysis and employed dual cutoff methodology, first within dimension and second across the dimension, to capture the impact and identify the multidimensional poor. In the study, a person is declared as multidimensionally poor, if the weighted indicators in which a person or household is deprived sum up to thirty percent and the proposed multidimensional poverty index satisfies the variety of axioms. The study computes the adjusted headcount ratio (which is the product of headcount ratio and average deprivation gap), that is decomposable by groups such as community, ethnicity, region, race, etc., as well as by dimension i.e. health, education or standard of living, to identify that which group or dimension is more influential in the overall poverty index for the targeted policy intervention.
3. Methodology
This section presents the main methodology for identification and measurement of both money metric poverty and multidimensional poverty in Tripura. For the purpose of the study two districts out of 4 districts of Tripura (according to Census, 2001) are selected. Before spelling out the essentials of research methodology, it is necessary to present a brief notion about the Planning Commission’s methodology as it is the base to our first stage of this research. In this regard this chapter gives details of those methodologies that have been applied by Planning Commission of India. This is followed by the detailed discussion of different approaches and methods of poverty analysis that has been utilized for the data analysis.
3.1.Characteristics of Sample
Regarding the detailed description about the samples and sampling technique applied for our study at first stage, out of four districts stratification was made on the basis of socioeconomic indicators. It is to be noted that during the time of survey the Census Report of India for the year 2011 was not published and so the selection of district and survey design is performed on the basis of previous census report, i.e., Census Report of India-2001 and with the help of Tripura Human Development Report-2007. Some suitable criteria are selected that empirically have been found to have close association with household poverty are chosen for the making selection of districts. Literacy and education are reasonably good indicators of development in a society. The literacy rate for different districts of Tripura in 2001 work out to be 77.30 for West Tripura District, 73.00 percent for South Tripura District, 69.90 percent for North Tripura and 60.90 percent for the population 7 years and above, which was 60.4
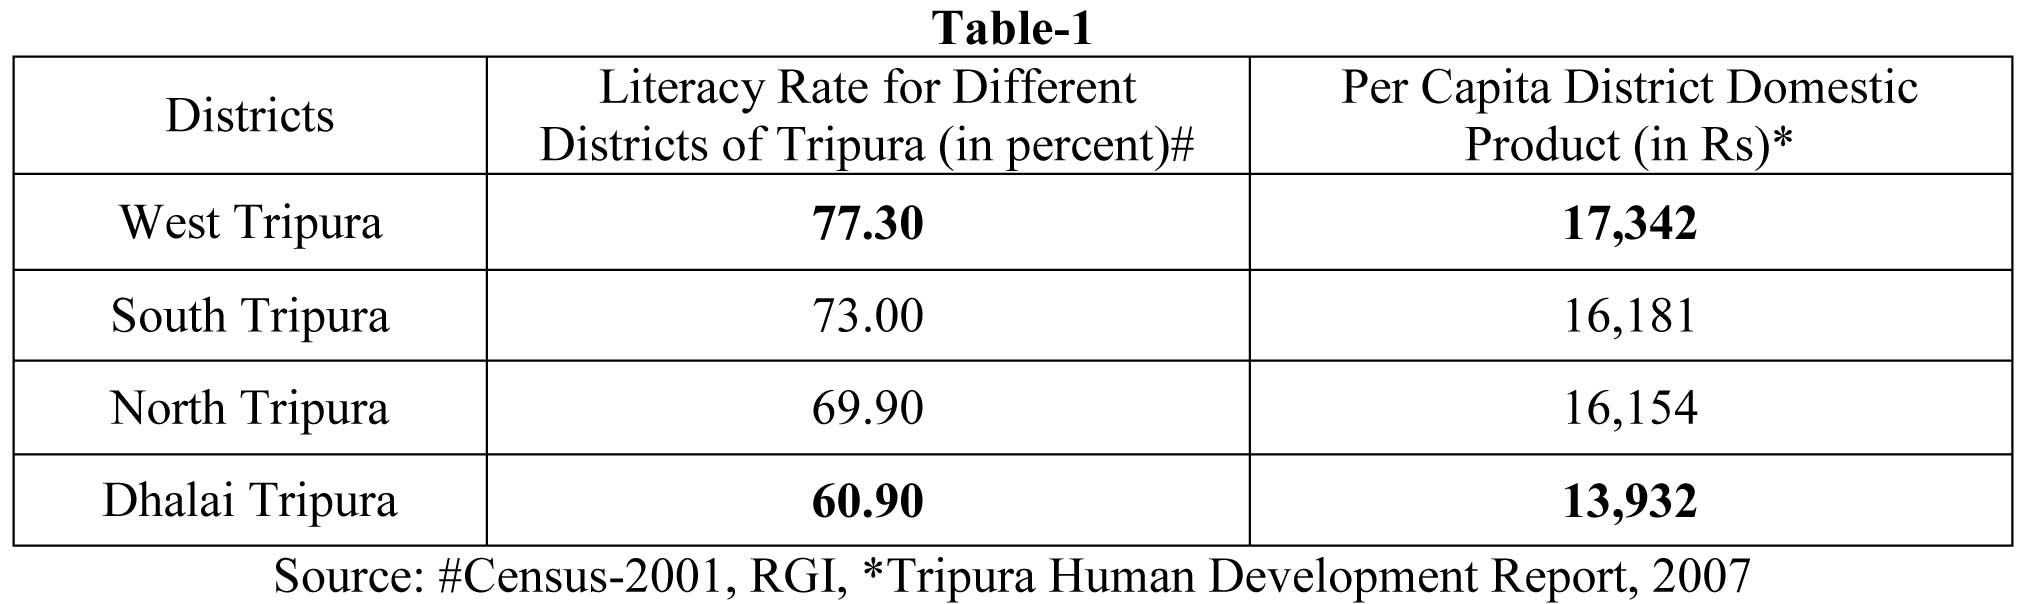
Per capita income is another important indicator to study poverty level of any region. Low per capita income provides higher possibility for incidence of poverty. The following table shows the per capita income or Per Capita District Domestic Product for all the four districts of Tripura. The secondary data shows that in case of Per Capita District Domestic Product West Tripura holds highest value (17,342) and Dhalai district holds lowest value (13,932).Under the likes of these two indicators of education and standard of living it is quite evident that among all the four districts of Tripura West Tripura appears to be socioeconomically developed district and Dhalai district appears to be socioeconomically backward district of Tripura. Thus for the purpose of the study two selected district are:
- West Tripura and
- Dhalai District
Villages and Municipal wards are taken as basic survey units (BSU) for our survey and for the rural and urban areas, respectively and for comprehensive study the households in both the urban and rural sectors are chosen as Ultimate sampling units (USUs). It is the total number of samples chosen for our study for the for the ultimate stage units. For present case total sample size is 300 household, combining both urban and rural areas. Total 200 households from West Tripura and 100 from Dhalai district are taken and within West Tripura district, 120 households would be selected from rural and 80 from urban areas in 60:40 proportion. In case of Dhalai district 60 households would be selected from rural and 40 from urban areas in 60:40 proportion. Considering the population distribution we have given relatively larger sample size for West Tripura district. Again, with same logic relatively larger sample size is given to the rural areas. Thus the justification for choosing more households from the rural sector is that in Tripura rural areas are comparatively larger than urban areas.Multistage sampling technique was adopted to make selection of the final stage units in both the rural sector and in urban blocks. Households formed the final stage units in both rural and urban sectors.
It is to be noted that for household level survey some generally accepted standard rules and definitions are provided by National Sample Survey Organisations, Government of India. In this research work those measuring methodology and definitions which is released by NSS 50th Round (July 1993-June 1994) are applied here.
3.2.Method for AF-Multidimensional Poverty Analysis
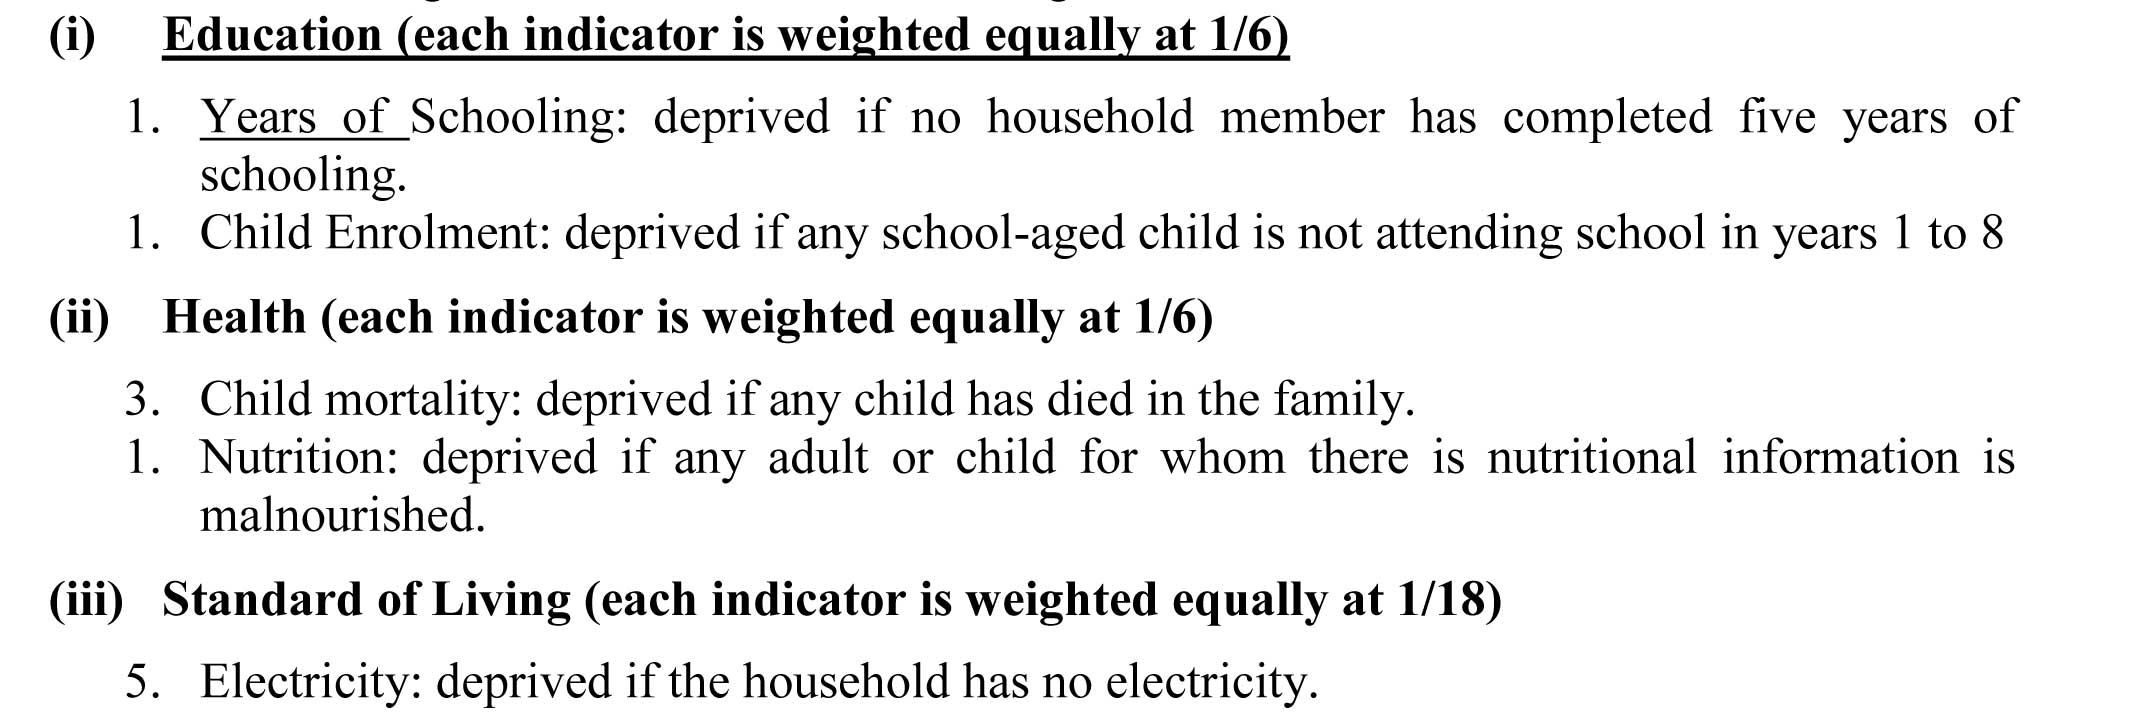
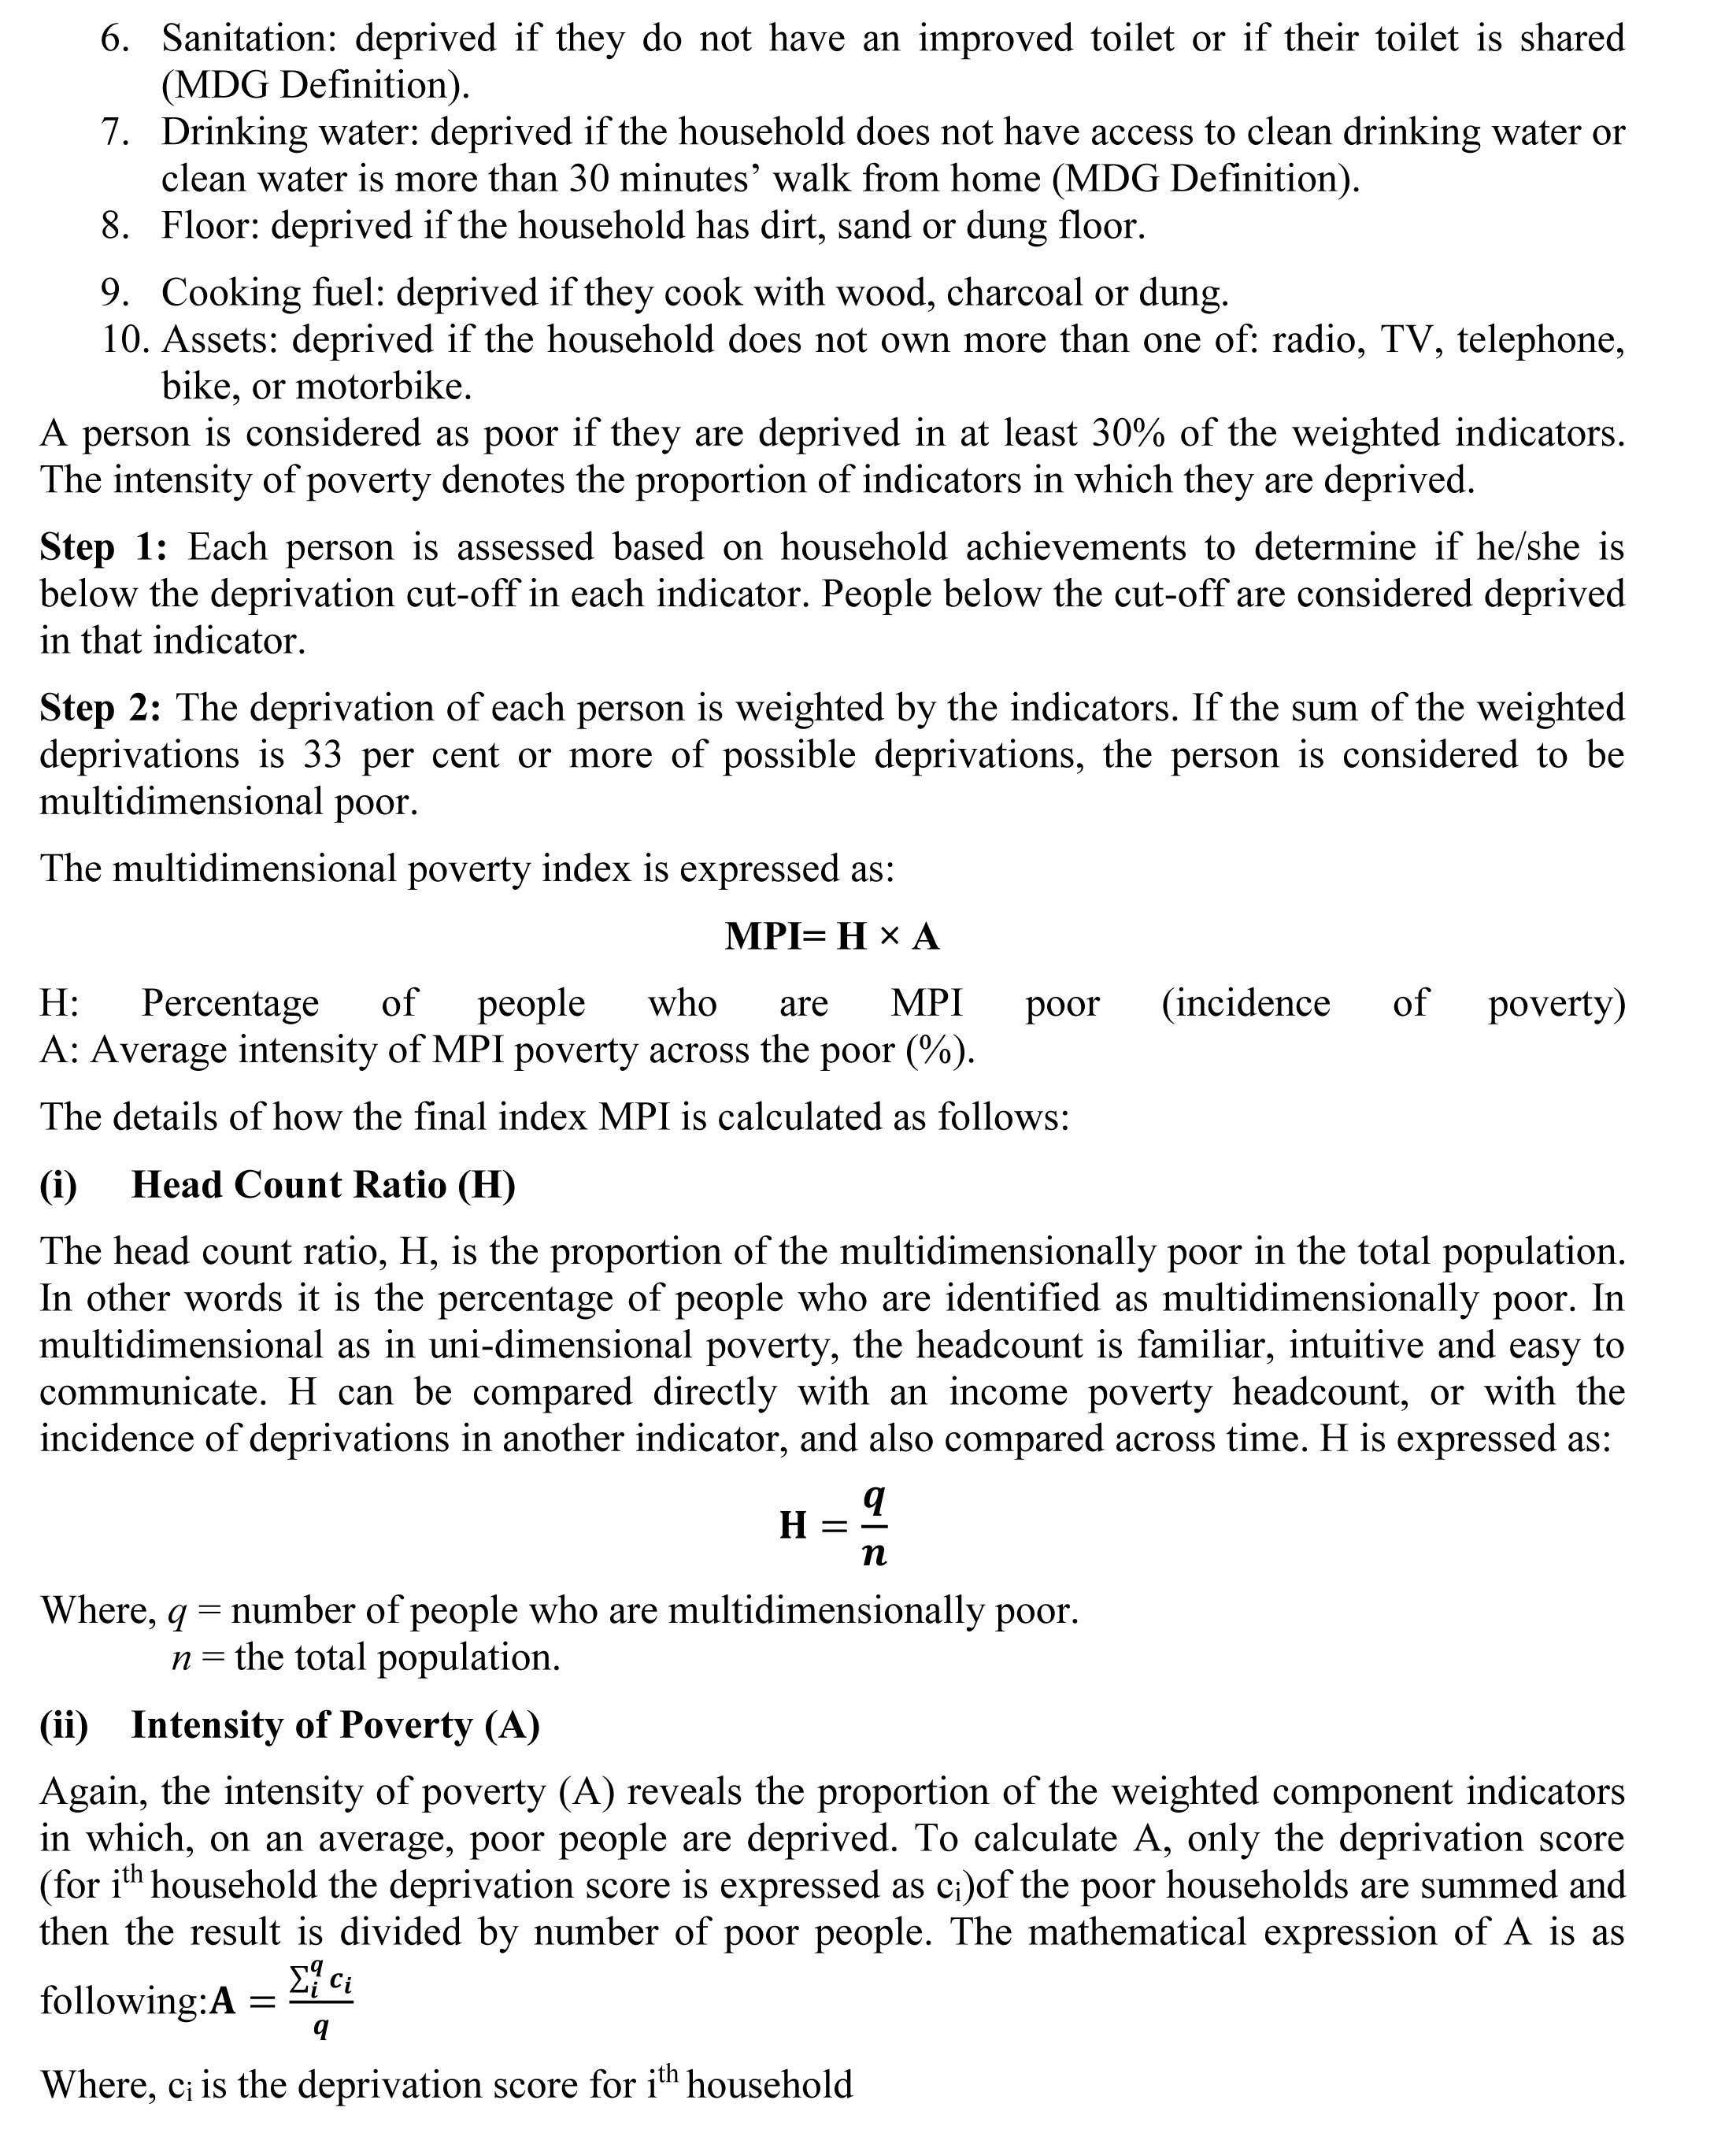
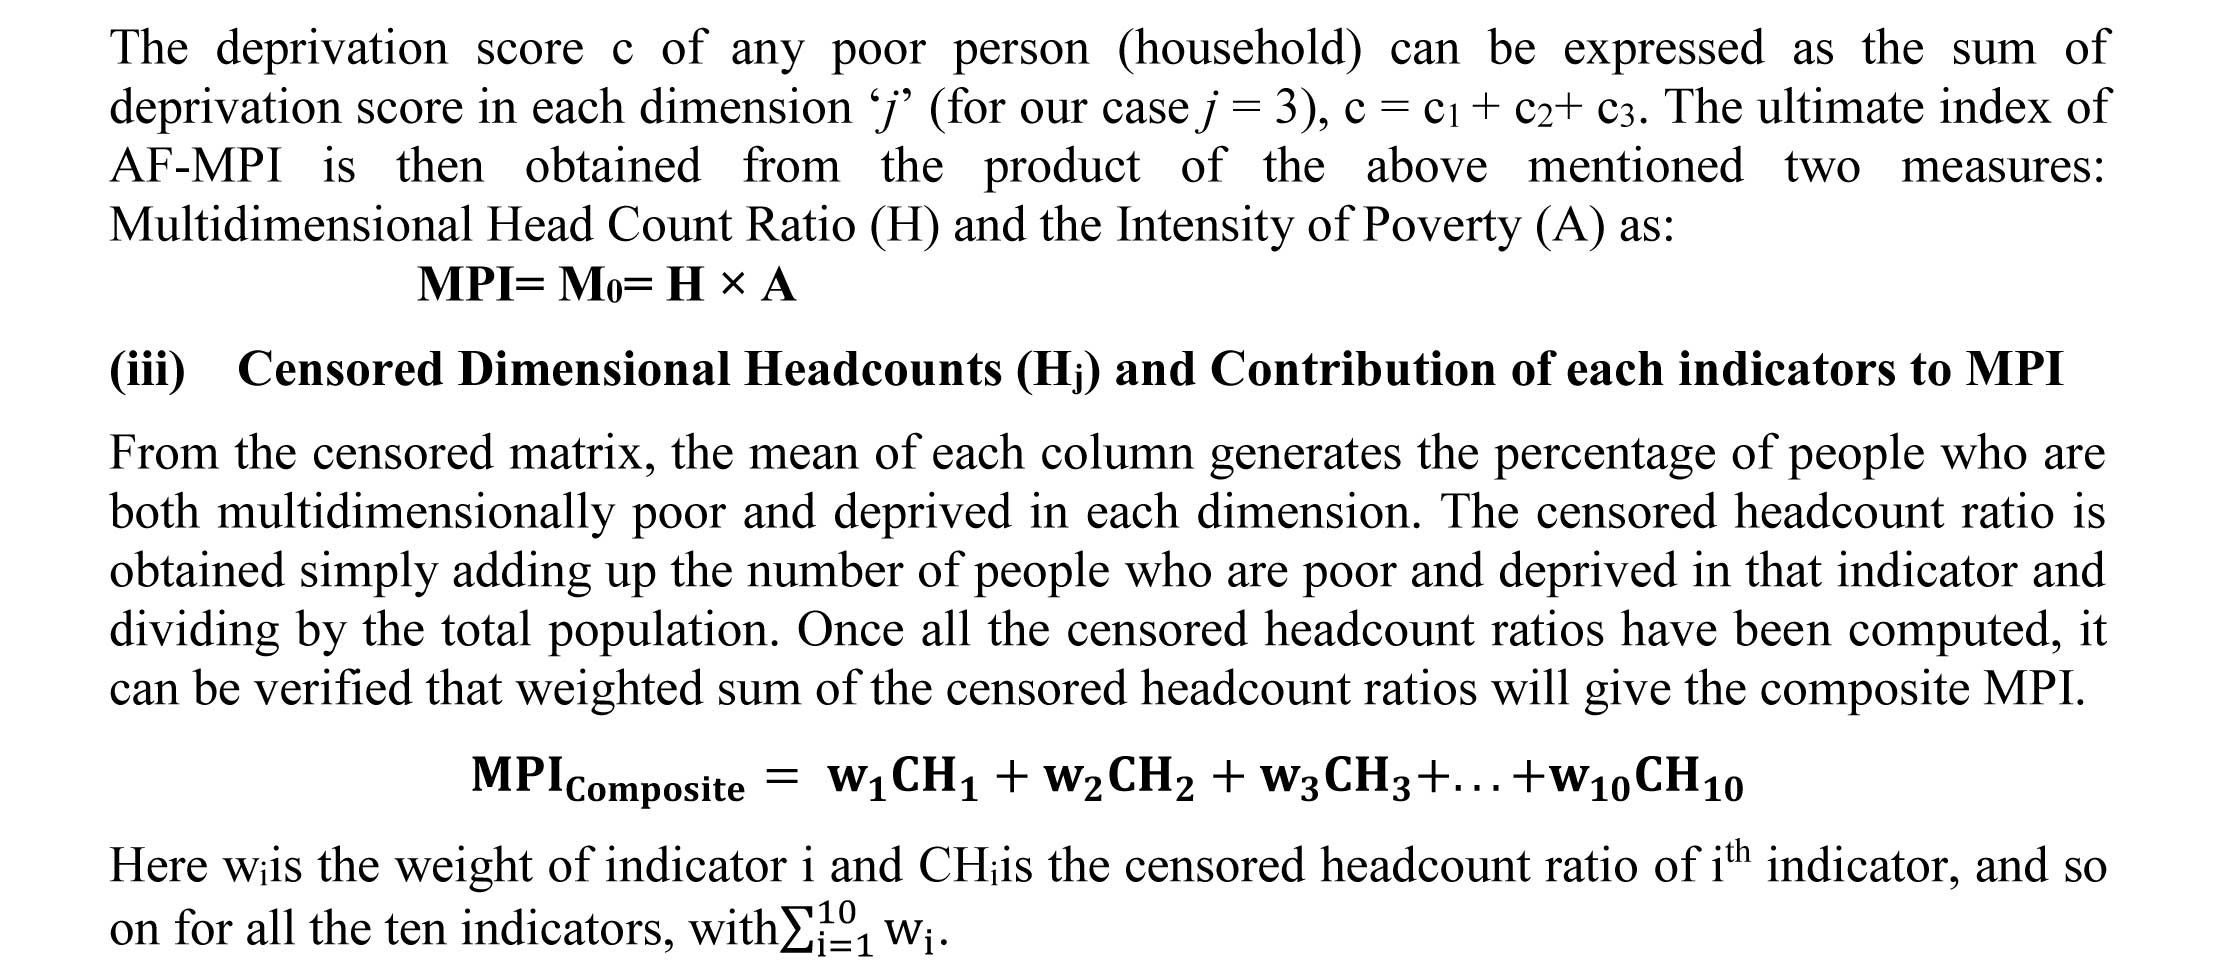
The Alkire Foster (AF) approach (Alkire and Foster, 2007) followed here is the approach released by UNDP Human Development Report Office and the Oxford Poverty and Human Development Initiative (OPHI) and it measures acute Multidimensional Poverty Index (MPI) (Alkire and Santos, 2010). The MPI is constructed using ten indicators covering three dimensions. The three dimensions are health, education, and standard of living. The indicators are nutrition (anthropometric measures) and child mortality for health; years of schooling and school attendance for education; and electricity, water, sanitation, cooking fuel, flooring, and asset ownership for living standard. Each dimension is equally weighted at one-third. Each indicator within a dimension is also equally weighted. The MPI is an index designed to measure acute poverty which refers to two main characteristics.
First, it includes people living under conditions where they do not reach the minimum internationally agreed standards in indicators of basic functioning, such as being well nourished, being educated or drinking clean water. Second, it refers to people living under conditions where they do not reach the minimum standards in several aspects at the same time. In other words, the MPI measures those experiencing multiple deprivations.
List of Indicators of MPI
All the indicators by which AF multidimensional index is calculated are put forward below (the definitions and their details are available in OPHIWorking Paper-7, 2009). The details of distribution of weight to all the ten indicators are given below:
3.3.Alternative Modelling: Fuzzy Set Approach
In an effort to weigh up to see whether a different methodology gives a better rationalisation of the poverty situation in Tripura in multidimensional sense, the application of diverse techniques is made. Then a comparison is made of analysis results derived from Money Metric Approach, AF-Multidimensional approach and the same approaches but with fuzzy analyses. This approach based on the earlier works by Zadeh in 1965 and introduced by Cerioli and Zani (1990) then extended by Cheli and Lemi (1994), Dagum et. al (1991), Dagum (2002). This theory stipulates that there is no clear cut between the poor and the non-poor due to fuzziness and vagueness on both the aggregate boundaries and within each indicator. So an individual considered poor is identified according to its degree of membership to fuzzy sub-sets with regard to each poverty attribute (Costa, 2003). Poverty should be regarded as a matter of grades and intensity rather than a dichotomous attribute that considers only two extremes, i-e the existence or lack of an attribute (Betti, et. al, 2005).Here we are considering the fuzzy set model as in the lines of the work of Dagum and Costa (2004) and Apiah-Kubi et al(2007). In our case we have considered all the attributes in dichotomous form where having an attribute is assigned the value ‘0’ and is considered as low risk to poverty and not having that attribute is assigned ‘1’ and considered as high risk of poverty. After a thorough assessment upon the requirement of our study the fuzzy set model has been transformed as following:
3.3.1.1.Method for Multidimensional Fuzzy Poverty Analysis
From the methodology applied by Costa(2002) and expounded the degree of membership to fuzzy set of poverty of the ith household ( i=1,2,3…….n) with respect to the jth attribute (j=1,2,….,m) as:

In other words one can write that Xj(ai) represents an m-order vector of socio-economic attributes (for present research m=10) which will result in the state of poverty of a household ai if the particular attribute is partially or not possessed by the household.
In this case:
4. Data Analysis
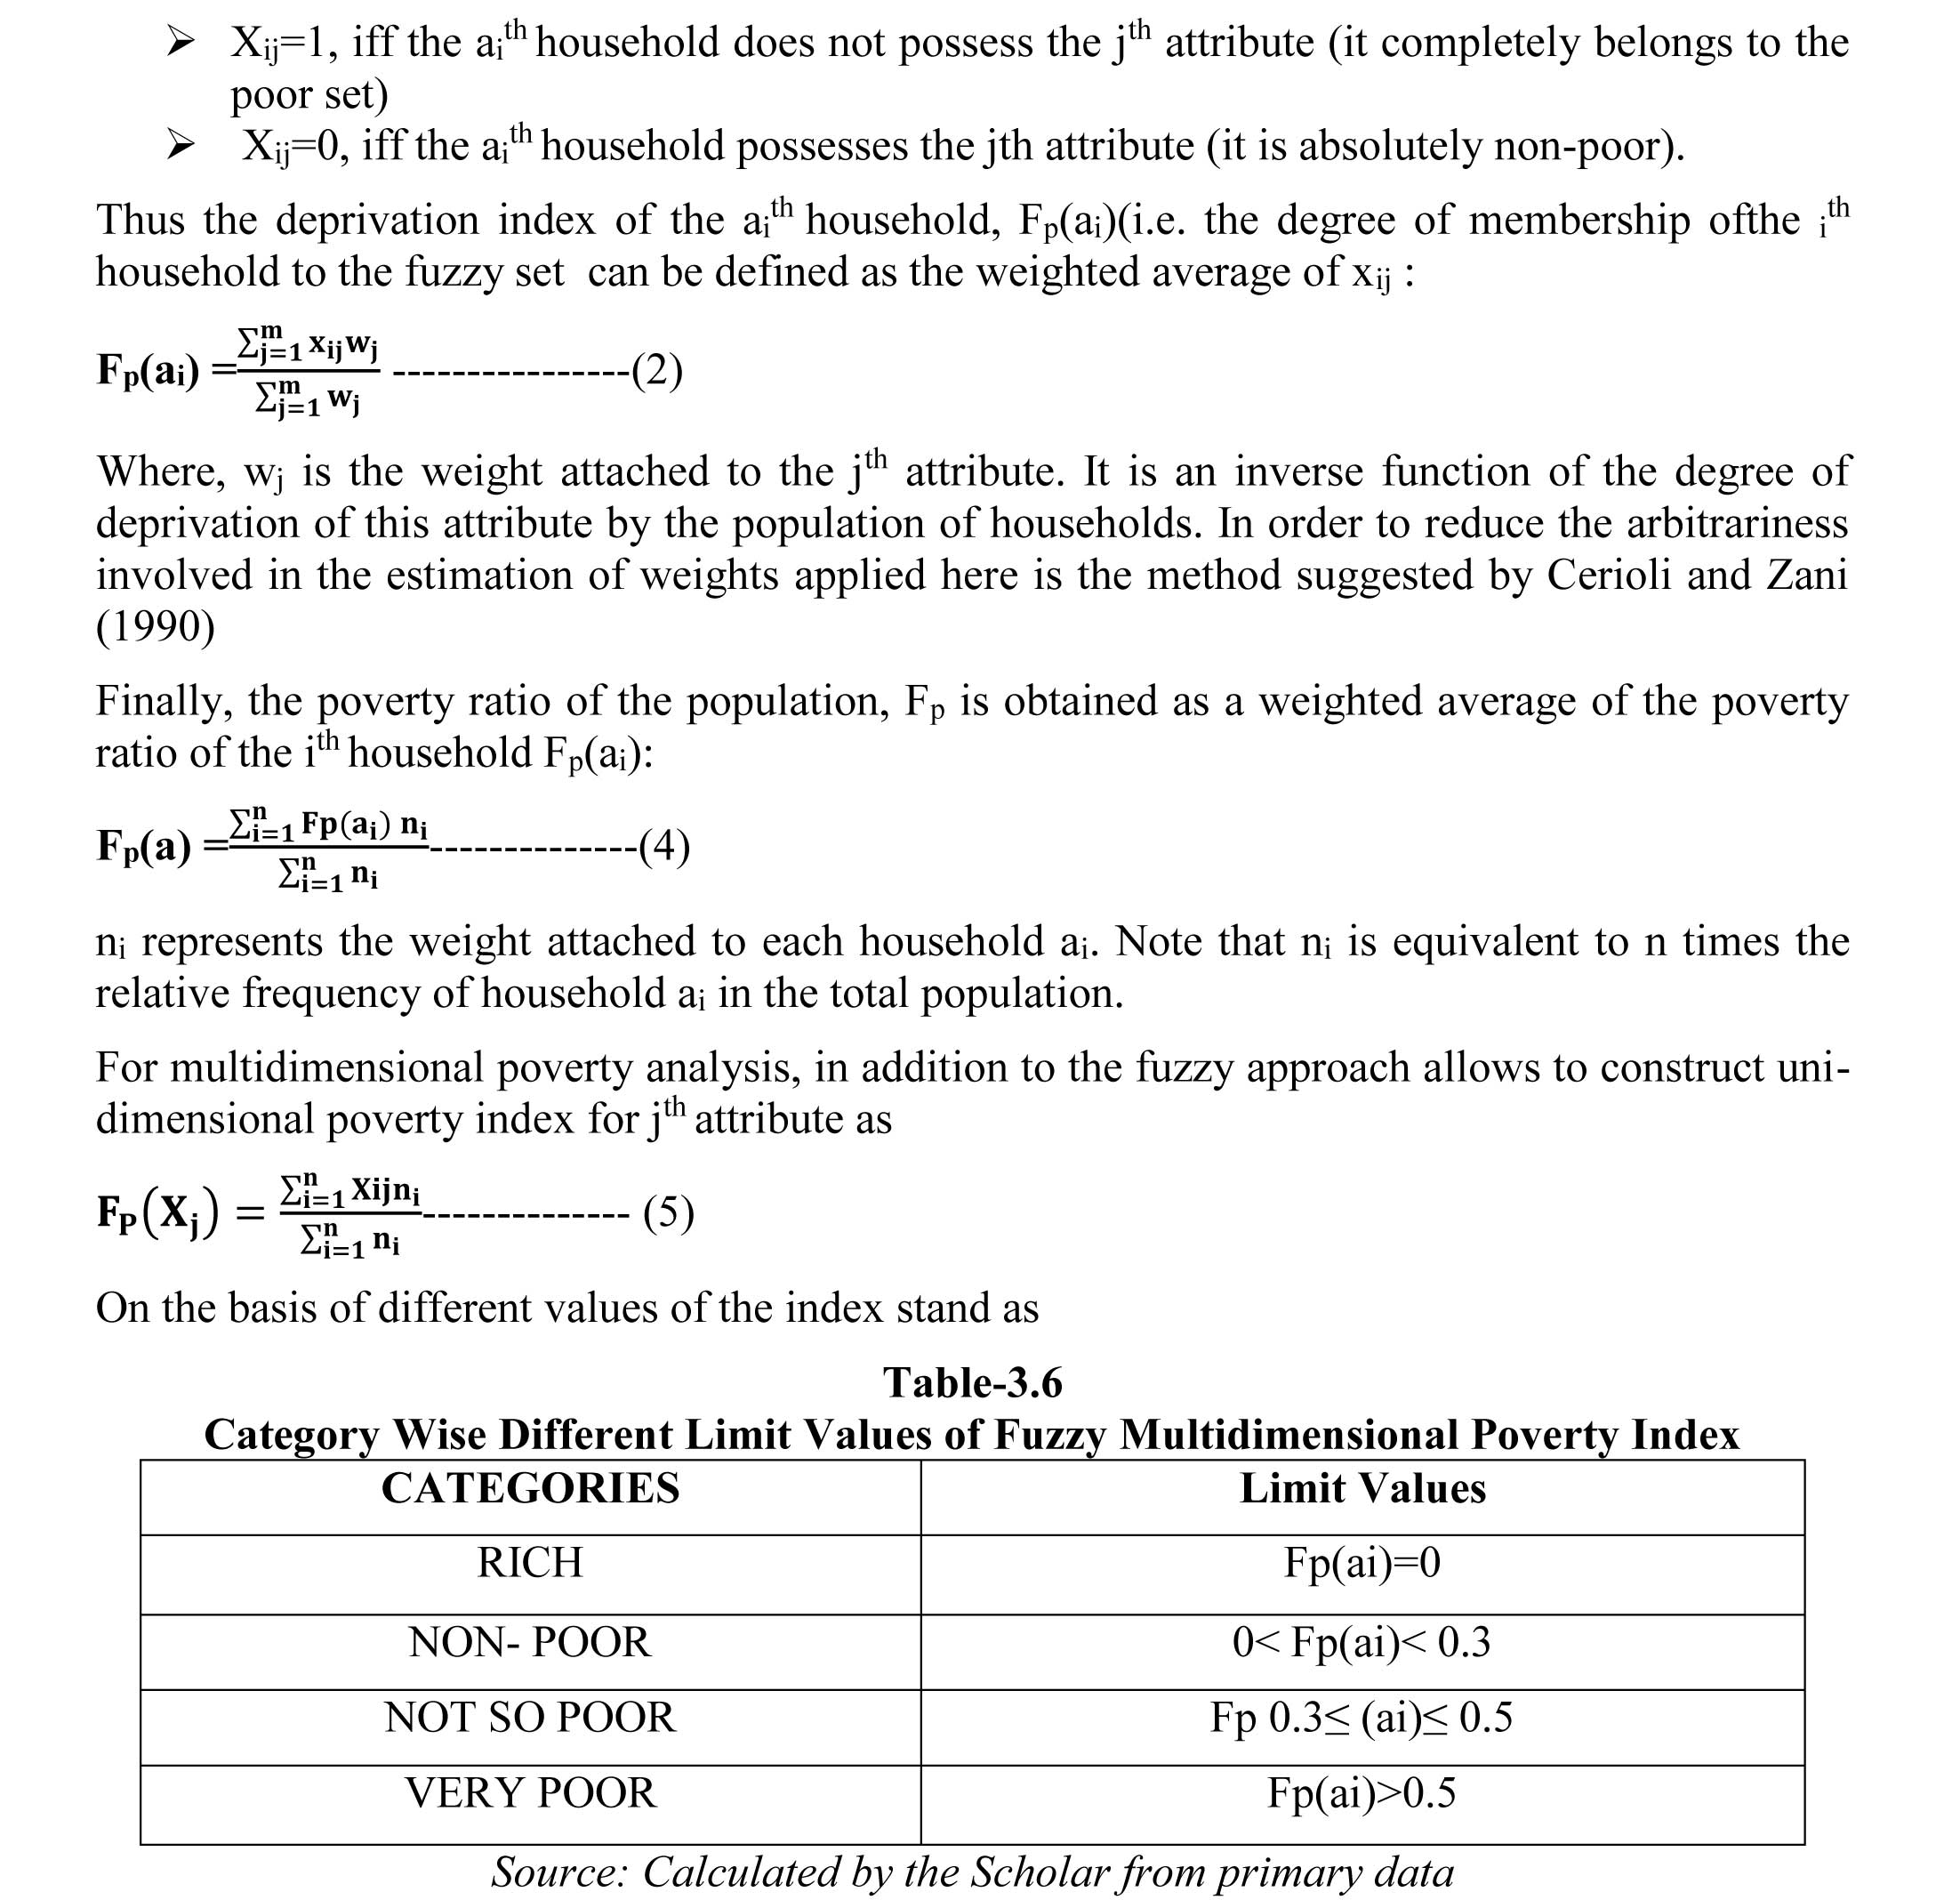
This section provides the results primary data analysis of poverty measurement by applying AF-Multidimensional method of analysis, which is the second objective of this research work. The interpretation for the results in table-1 reveals that for rural areas of West Tripura district, 48 percent of people are MPI poor. It is also witnessed that on average the poor here are deprived in 45 percent of the weighted indicators. The value of MPI index, M0 is 0.215. The MPI represents the share of the population that is multidimensionally poor adjustedby the intensity of the deprivation suffered. This adjustment is necessary because only looking at H one can merely know that 47 per cent of the population is poor. But all of them are not equally poor and also they are not deprived in 100 per cent of all the considered deprivations.The average poor person is deprived in 45 per cent of the weighted indicators, so the intensity is 45 percent (These are called weighted‖ indicators, because to create the deprivation score ci where each deprivation is entered according to its relative weight). For the rural areas of Dhalai district, 68 percent households are multidimensionally poor where on an average poor person is deprived in 55 percent of the weighted indicator, as the intensity is 55 percent. The value of M0 is 0.375. For urban areas of Dhalai it is found that 15 percent of the people are MPI and the average poor person is deprived in 45 per cent of the weighted indicators. Finally, the aggregate figure for Tripura shows that 37 percent of people are multidimensionally poor and the average poor person is deprived in 49 per cent of the weighted indicators. The final weighted index value of MPI for Tripura is 0.181.
Alternative Estimation by Fuzzy Set Approach
As it is already mentioned in details in the methodology chapter that for the purpose of Fuzzy Multidimensional Poverty Analysis the values of Fuzzy Multidimensional Poverty Index, which is expressed as Fp(ai), is subdivided into four groups according to different range values of the index :
First Group: Rich: here the range value of the index is Fp(ai) = 0
Second Group: Non-Poor: here the range value of the index is 0
Fourth Group: Very Poor: here the range value of the index is 0.5
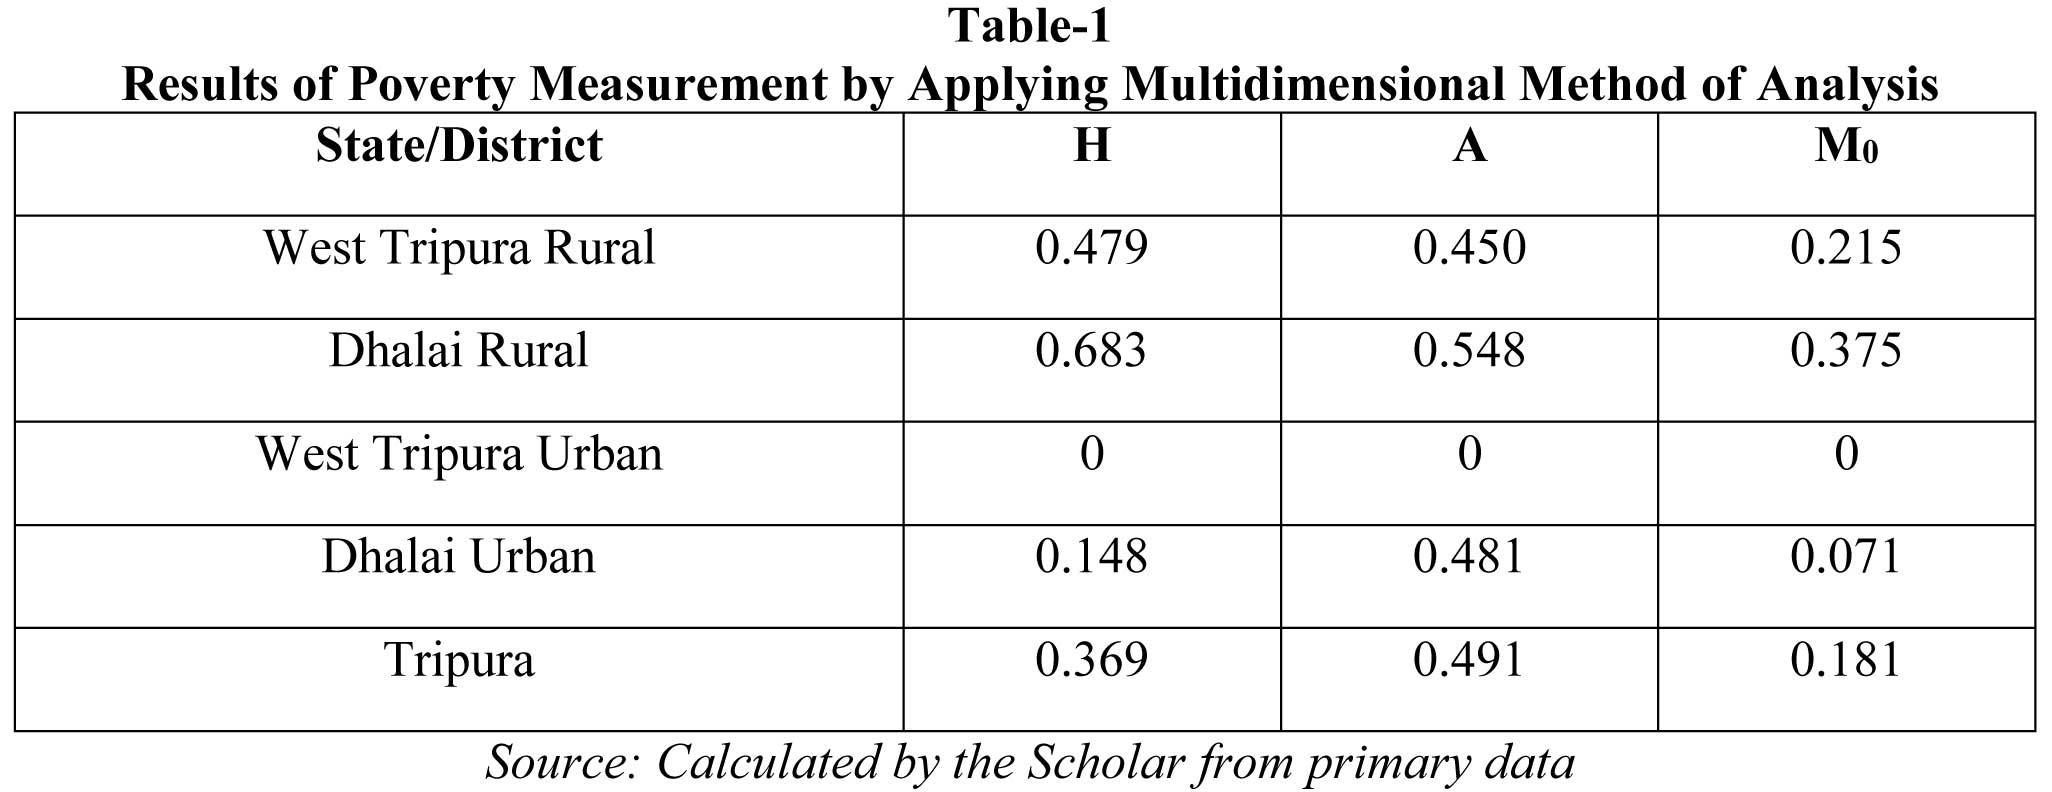
In the table-2 shows the analysis results for Fuzzy Multidimensional Poverty estimates for West Tripura District of Tripura. From the table one can comprehend thatout of total 120 households only 1.67 percent households ( 2 households) fall under the categoryof non-poor, 90 percent households (107 households) fall under the not so poor group and in total 9.16 percent households fall under either poor or very poor group ( 10 and 1 households respectively). The same result has been presented graphically in figure 5.7.
In the table-3 we have the analysis results for Fuzzy Multidimensional Poverty estimates for urban areas of West Tripura District of Tripura. From the table we can understand thatout of total 80 households 35 percent households ( 28 households) fall under the categoryof non-poor, 63.75 percent households (51 households) fall under the not so poor group and only 1.25 percent households fall under very poor group ( 1 households). The same result has been presented graphically in figure 5.8.
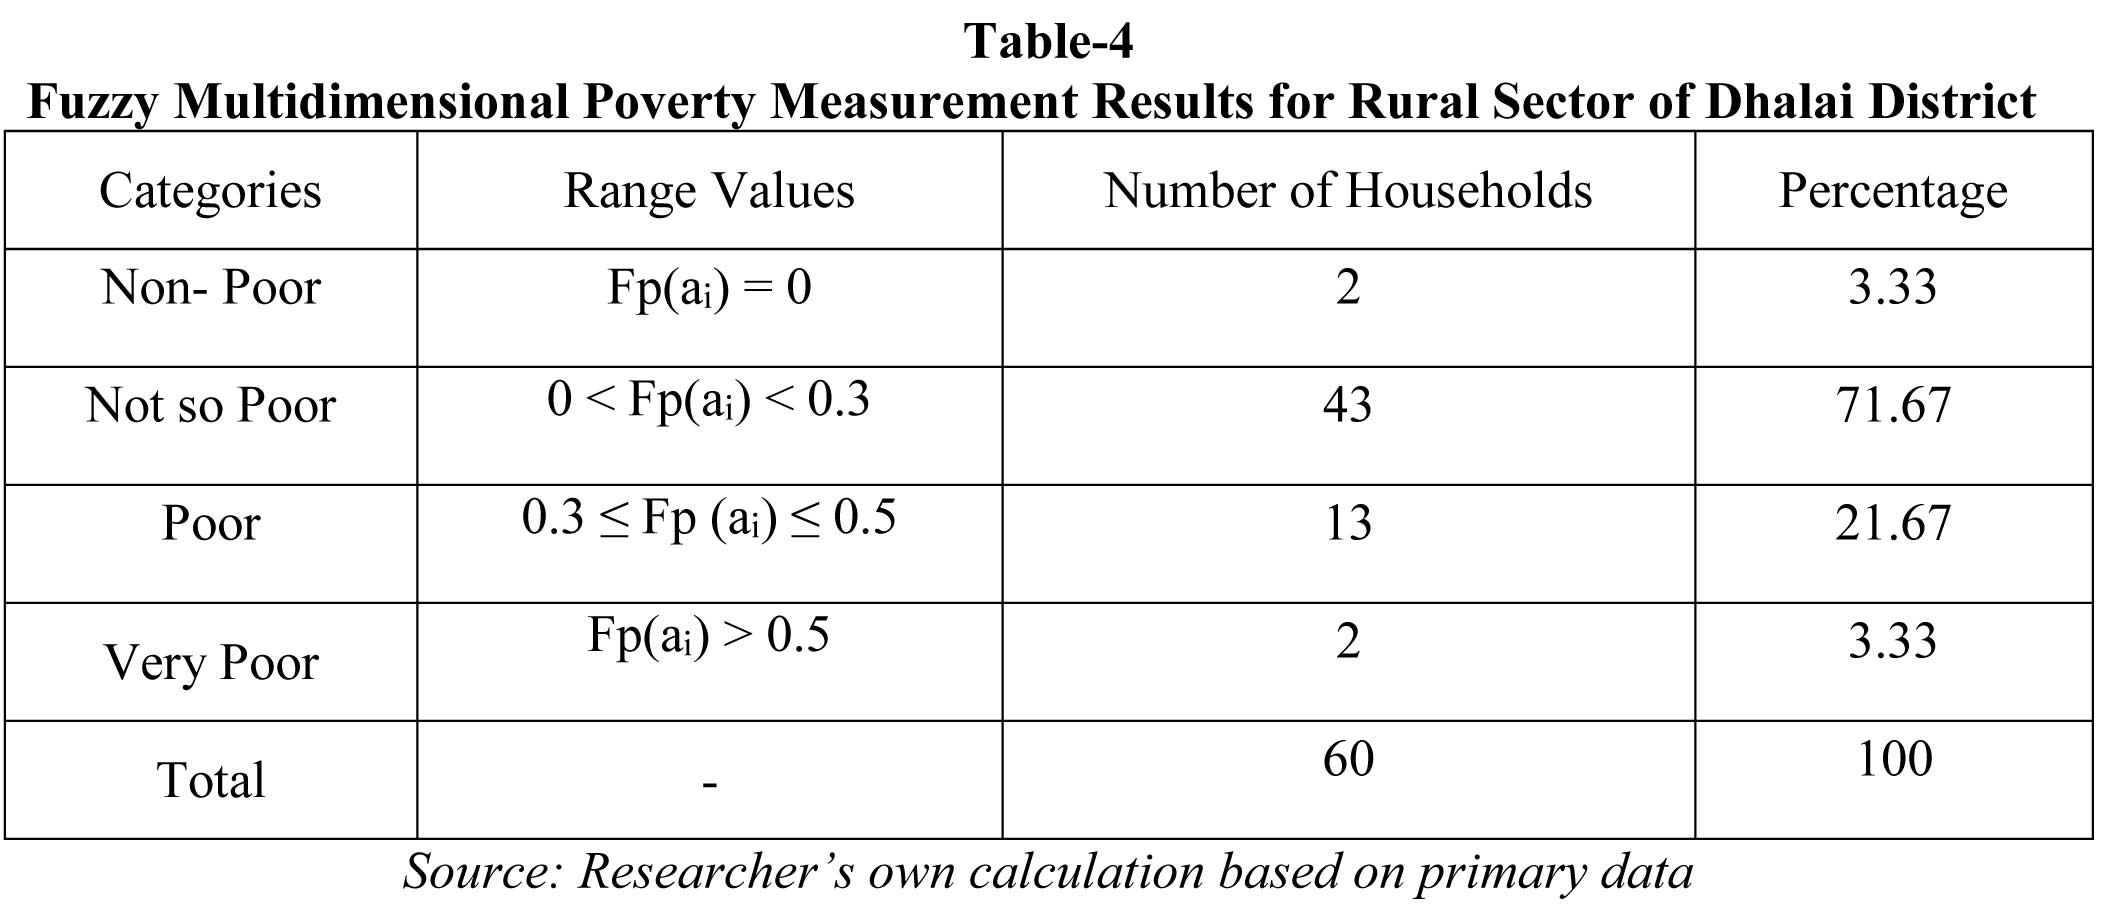
The table-4 provides the analysis results for Fuzzy Multidimensional Poverty estimates for rural areas of Dhalai District of Tripura. From the table we can know thatout of total 60 households only 3.33 percent households ( 2 households) fall under the categoryof non-poor, 71.67 percent households (43 households) fall under the not so poor group, 21.67 percent households fall under poor group (13 households) and 3.33 percent under very poor group ( 2 households respectively). The same result has also been presented graphically in figure 5.9.
The table-5 illustrates the analysis results for Fuzzy Multidimensional Poverty estimates for urban areas of Dhalai District of Tripura. From the table we can know thatout of total 40 households 15 percent households ( 6 households) fall under the categoryof non-poor, 67.50 percent households (27 households) fall under the not so poor group, 10 percent households fall under poor group (4 households) and 7.5 percent under very poor group ( 3 households respectively). The same outcome has also been graphically presented in figure 5.10.

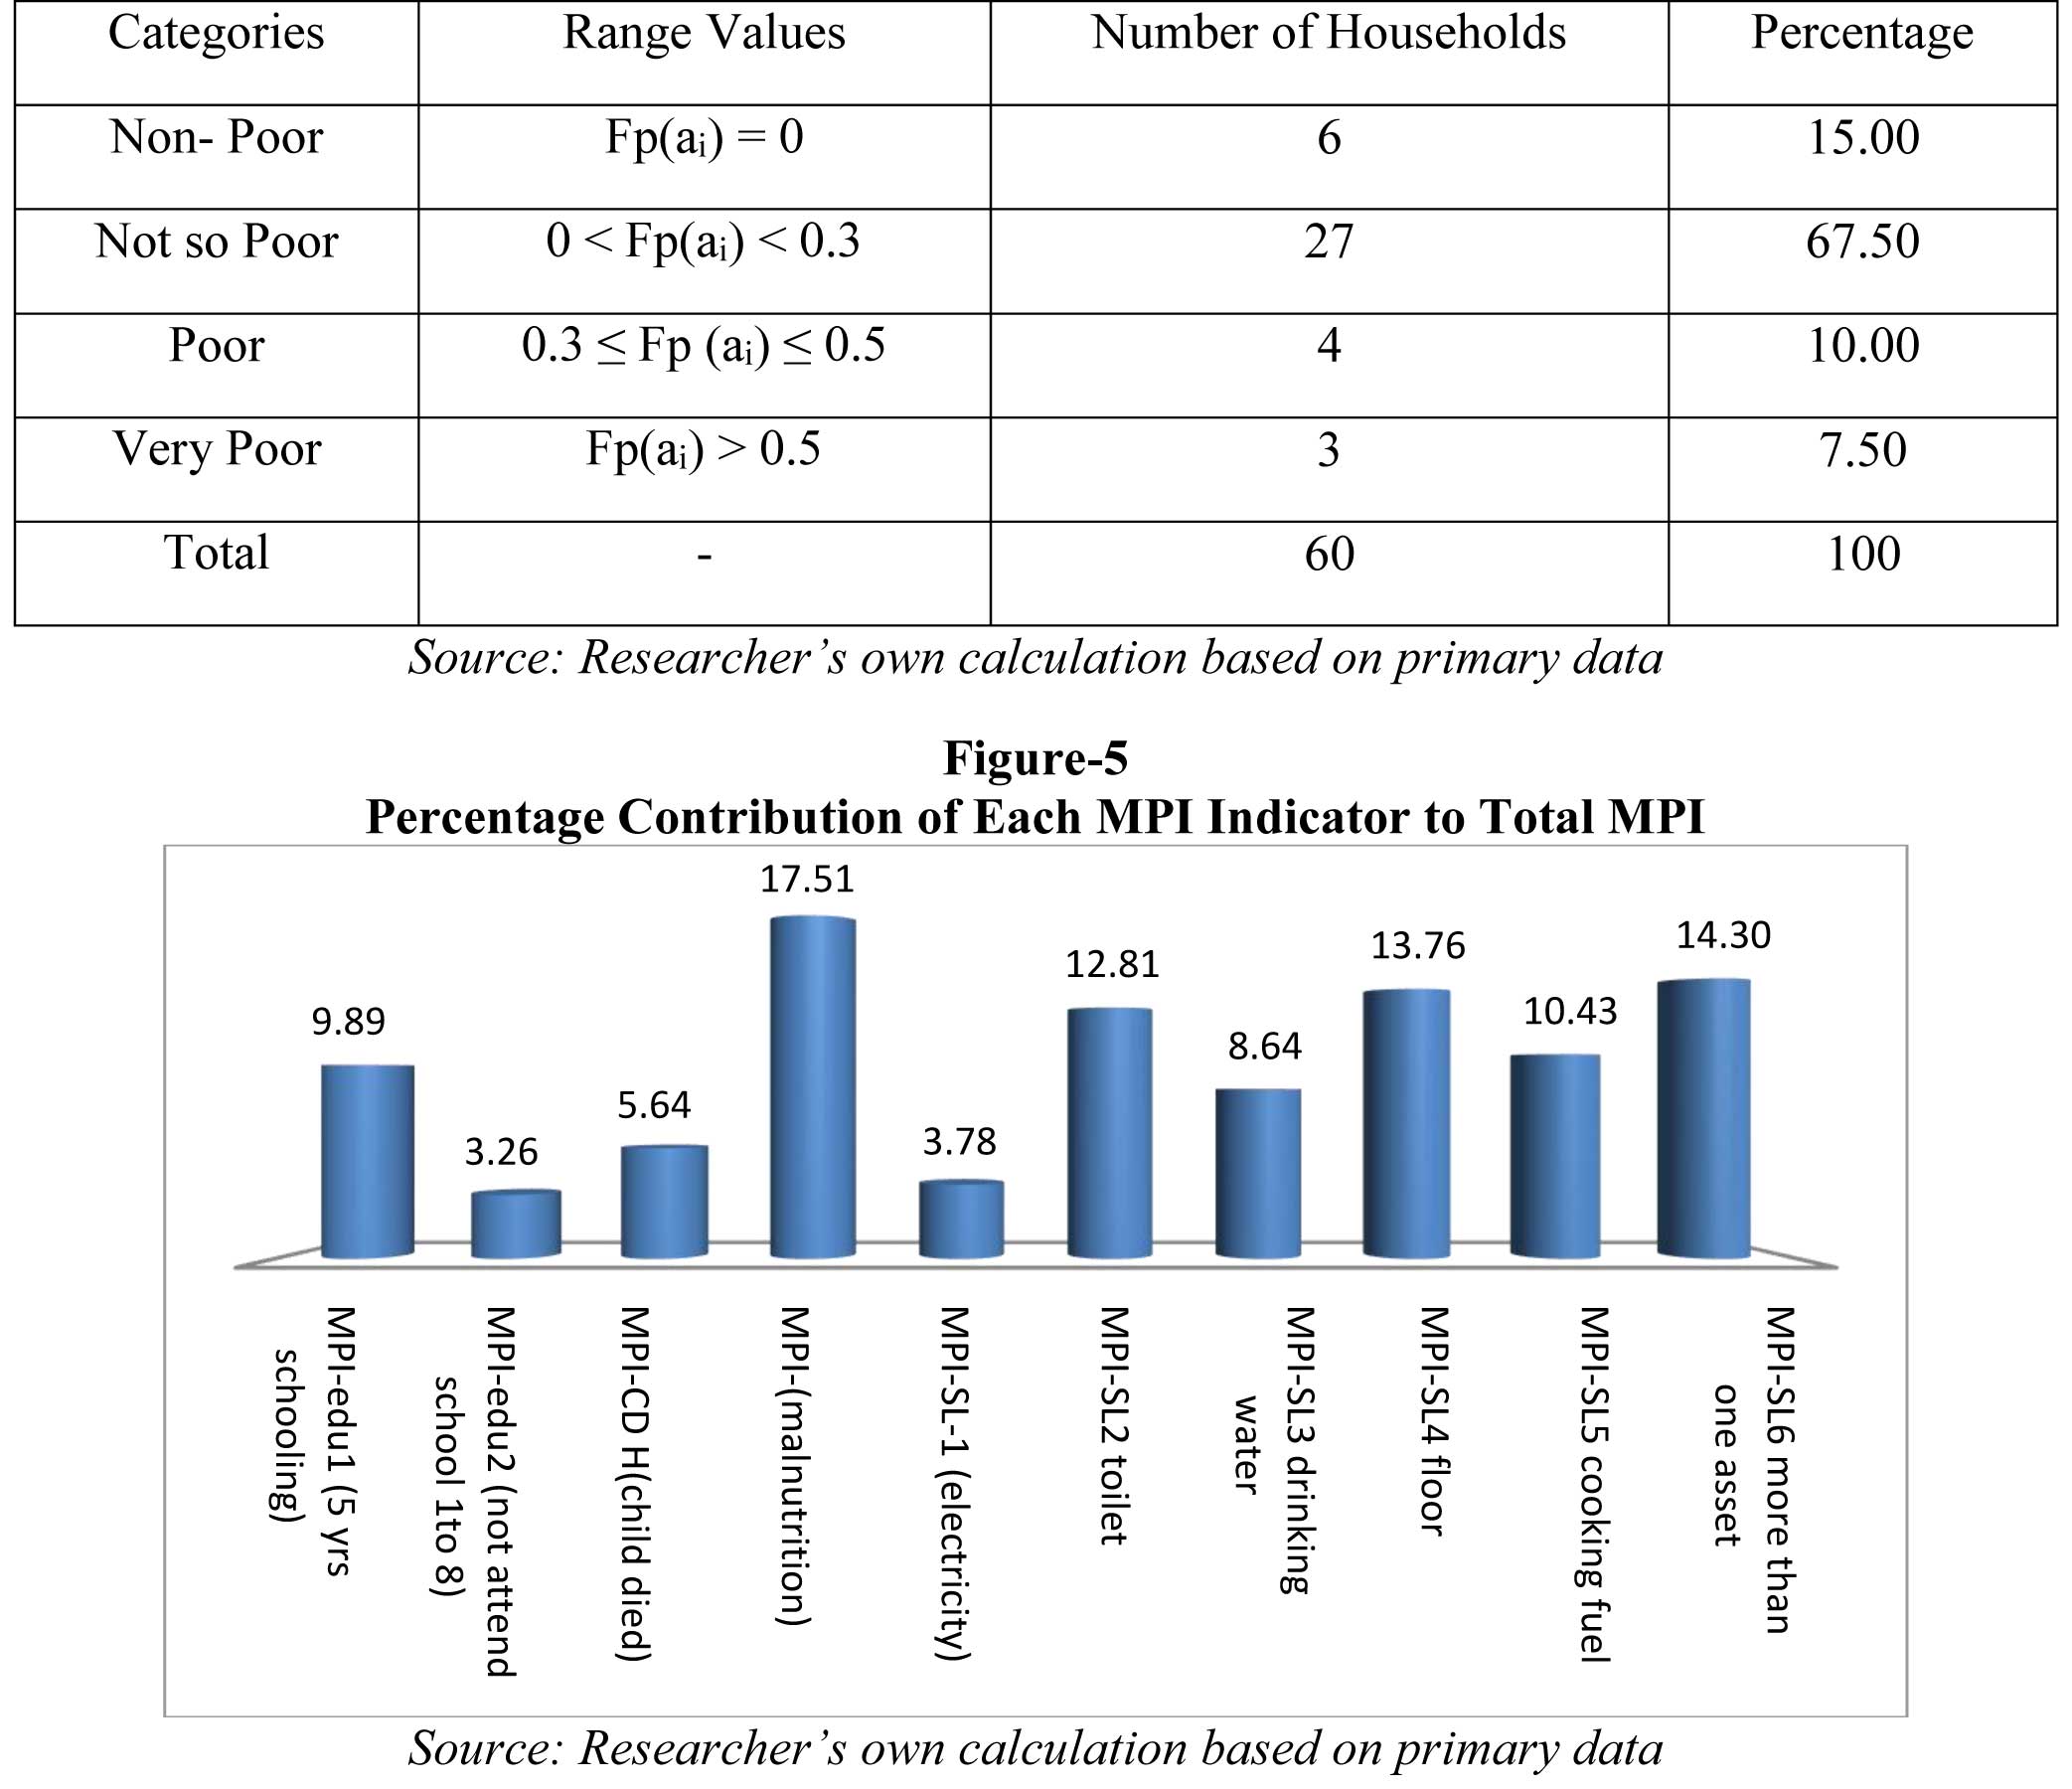
Figure-5 expresses the Percentage Contribution of Each MPI Indicator to Total MPI. It can be understand from the figure that the maximum contributor to the total MPI is malnutrition indicator where its contribution is 17.51 percent. Thus, malnutrition appears to be the most important indicator for multidimensional deprivation of households of Tripura. The next important indicator is more than one asset (with contribution of 14.30 percent), condition of floor (with contribution of 13.76 percent) which is followed by toilet facility (with contribution of 12.81 percent), cooking fuel (10.43), Schooling (with contribution of 9.89 percent) and drinking water facility (with contribution of 8.64 percent) and so on. In figure-5.12 and figure-5.13 results for attribute wise deprivation level or attribute wise poverty index for both rural and urban sector of West Tripura District by all the 10 attributes of multidimensional poverty index are graphically portrayed. From figure-5 we can easily understand that FP(X10) shows the maximum value which clarifies that the more than one asset indicator appears to be the most important indicator for multidimensional deprivation of households of the rural sector of the West Tripura district of Tripura. The next important indicator is condition of floor which is followed by toilet facility, drinking water facility and cooking fuel. Thus for the multidimensional deprivation of households of the said area most of the standard of living indicators are relatively more important cause of poverty.
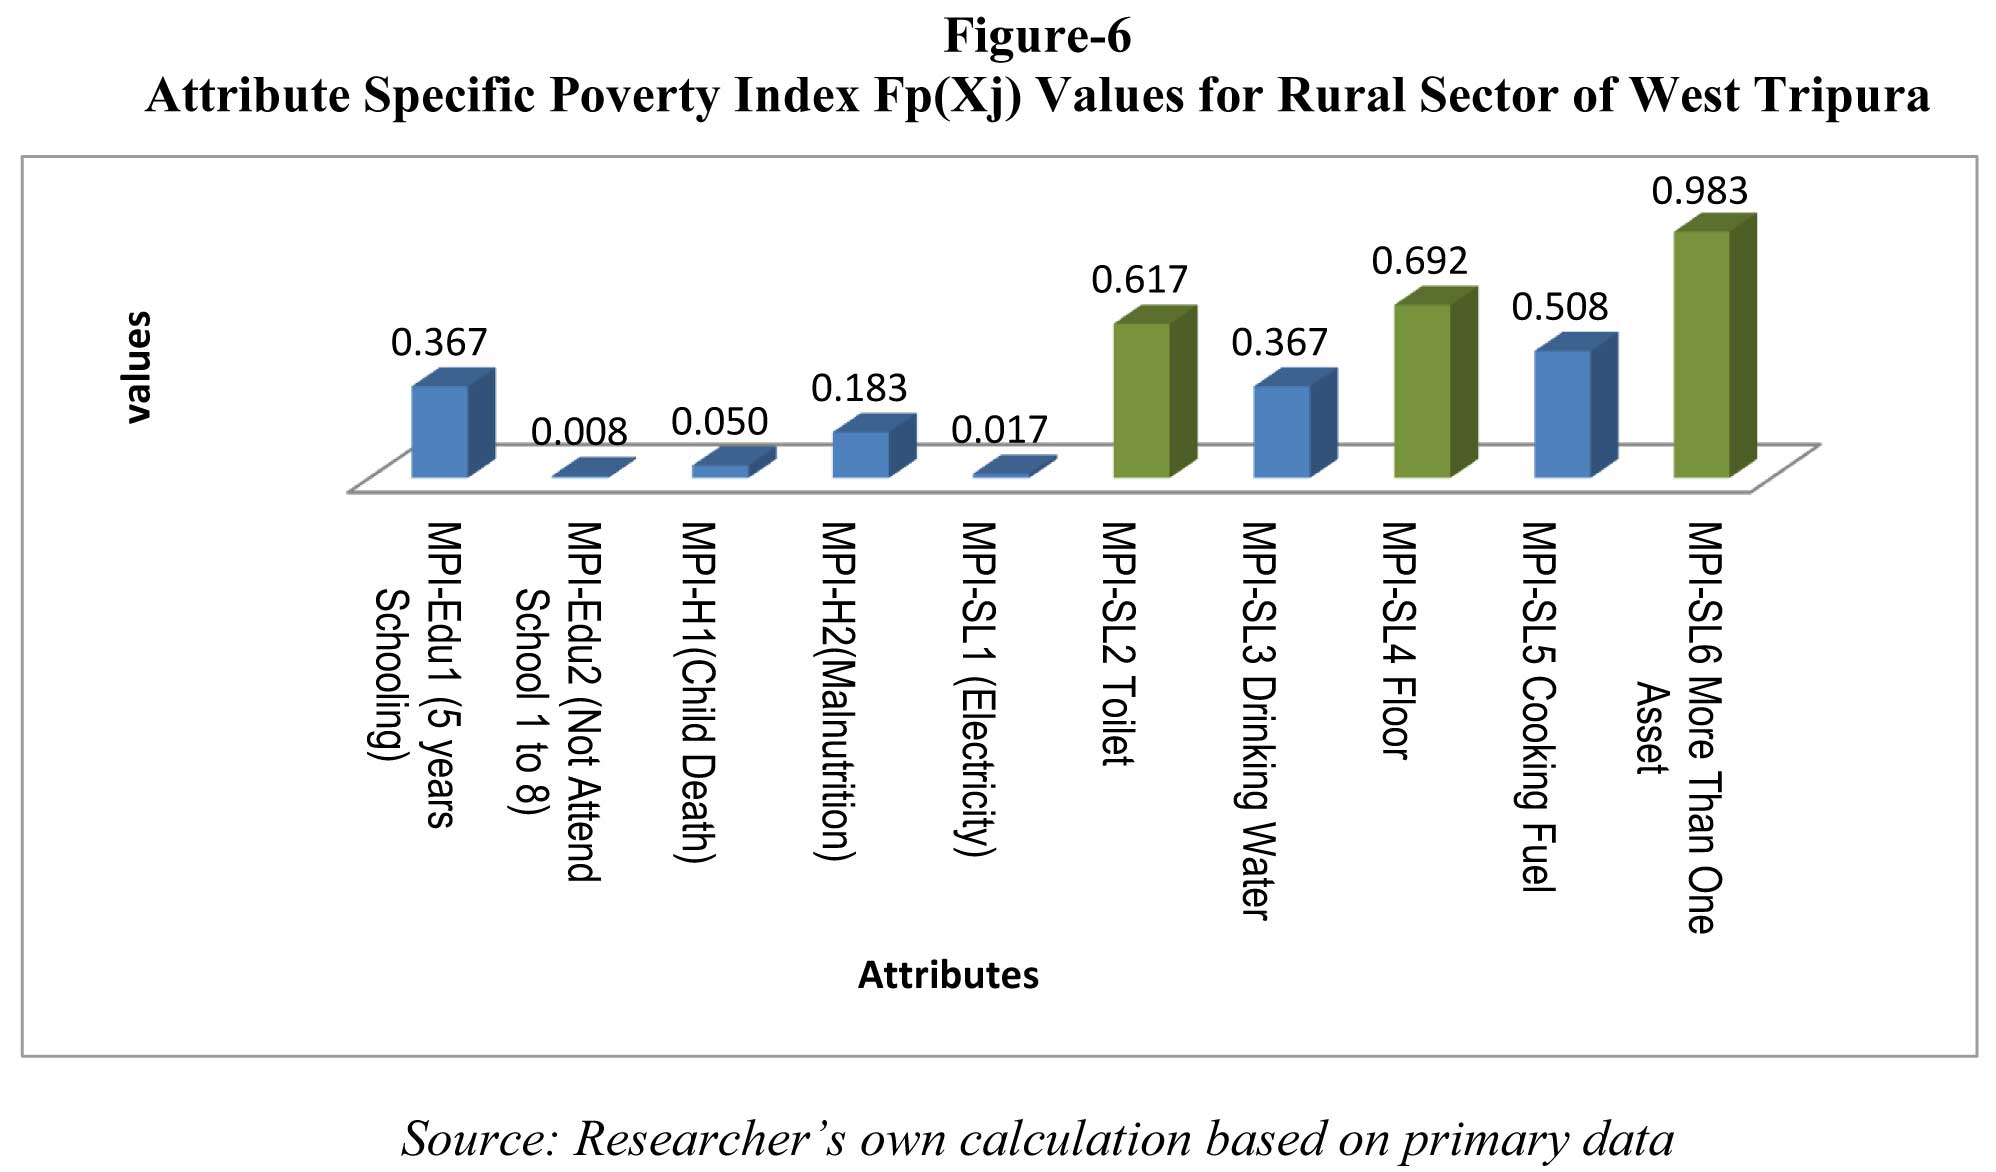
From figure-6 it is observed that FP(X10) shows the maximum value which clarifies that the more than one asset indicator appears to be the most important indicator for multidimensional deprivation of households of the rural sector of the West Tripura district of Tripura. Other indicators are not having that much high value.
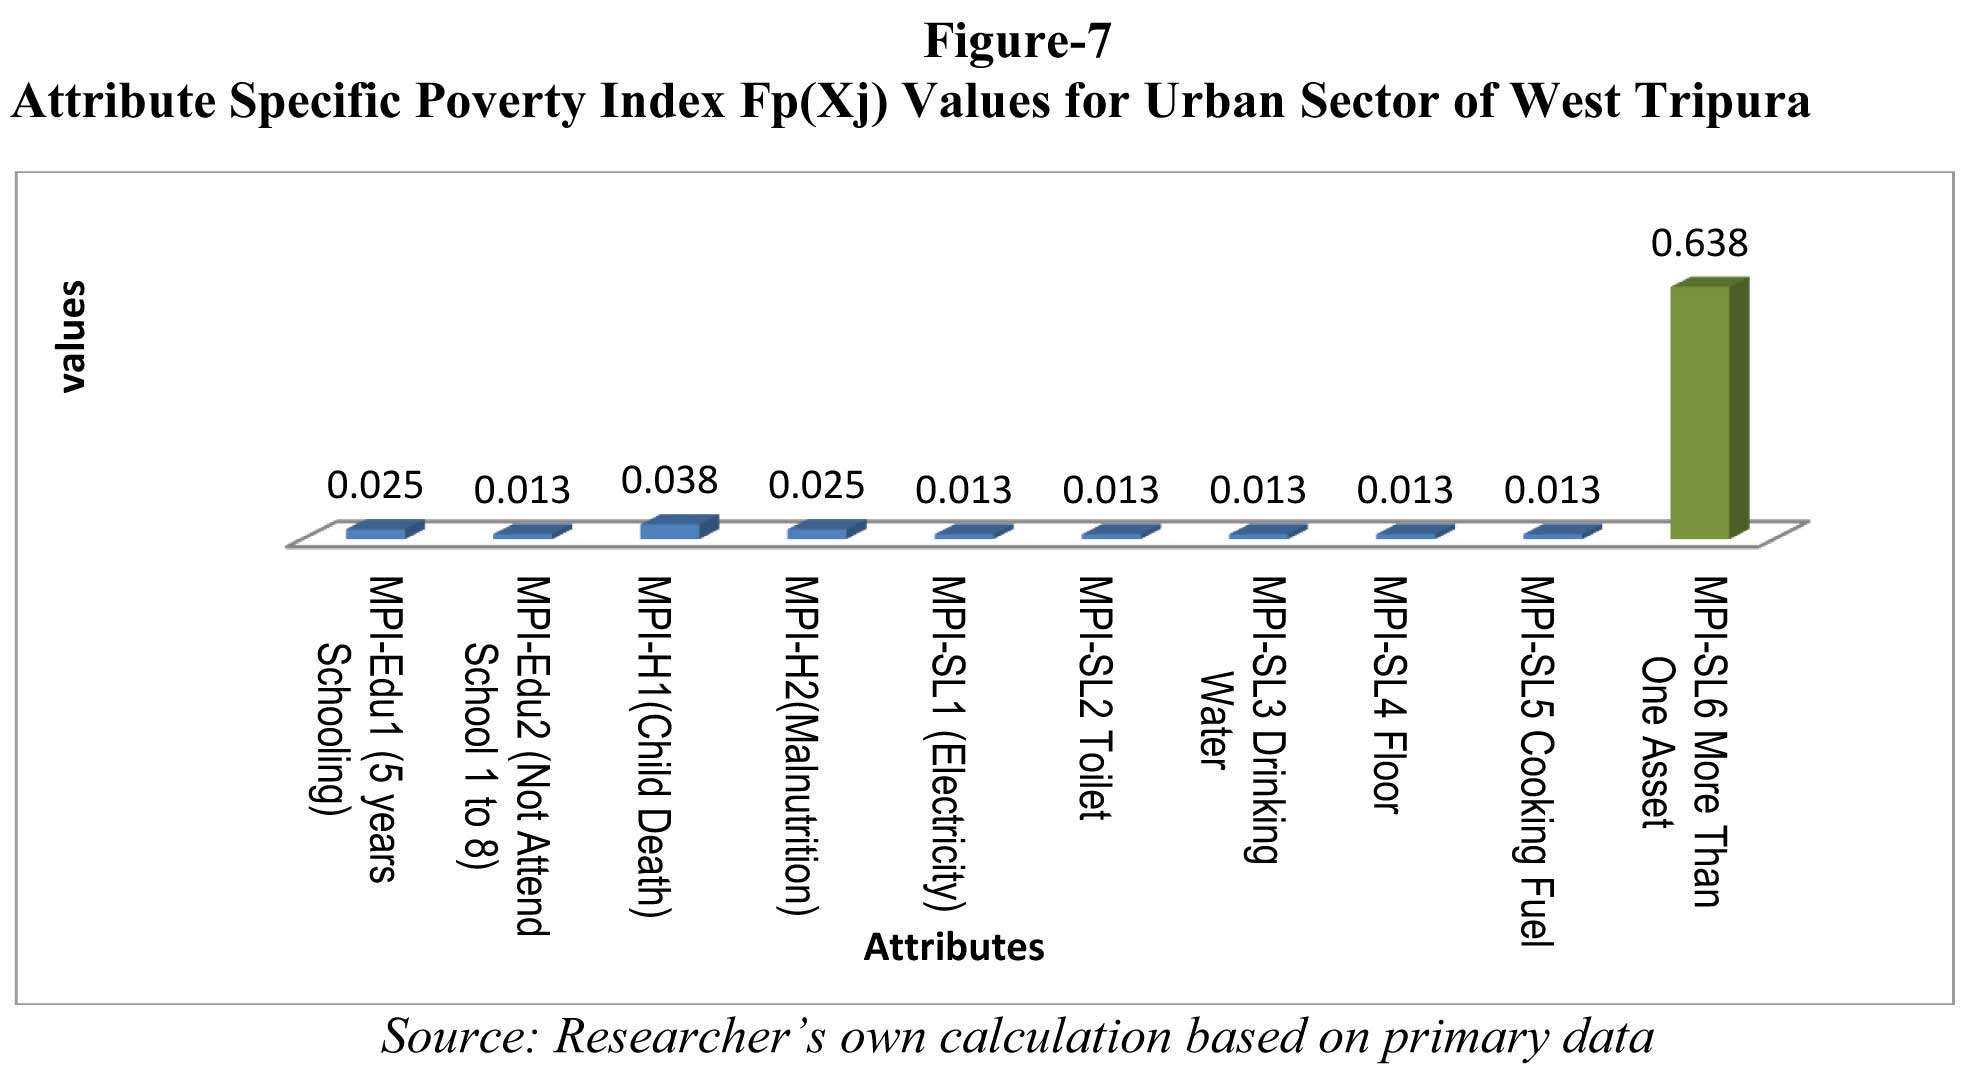
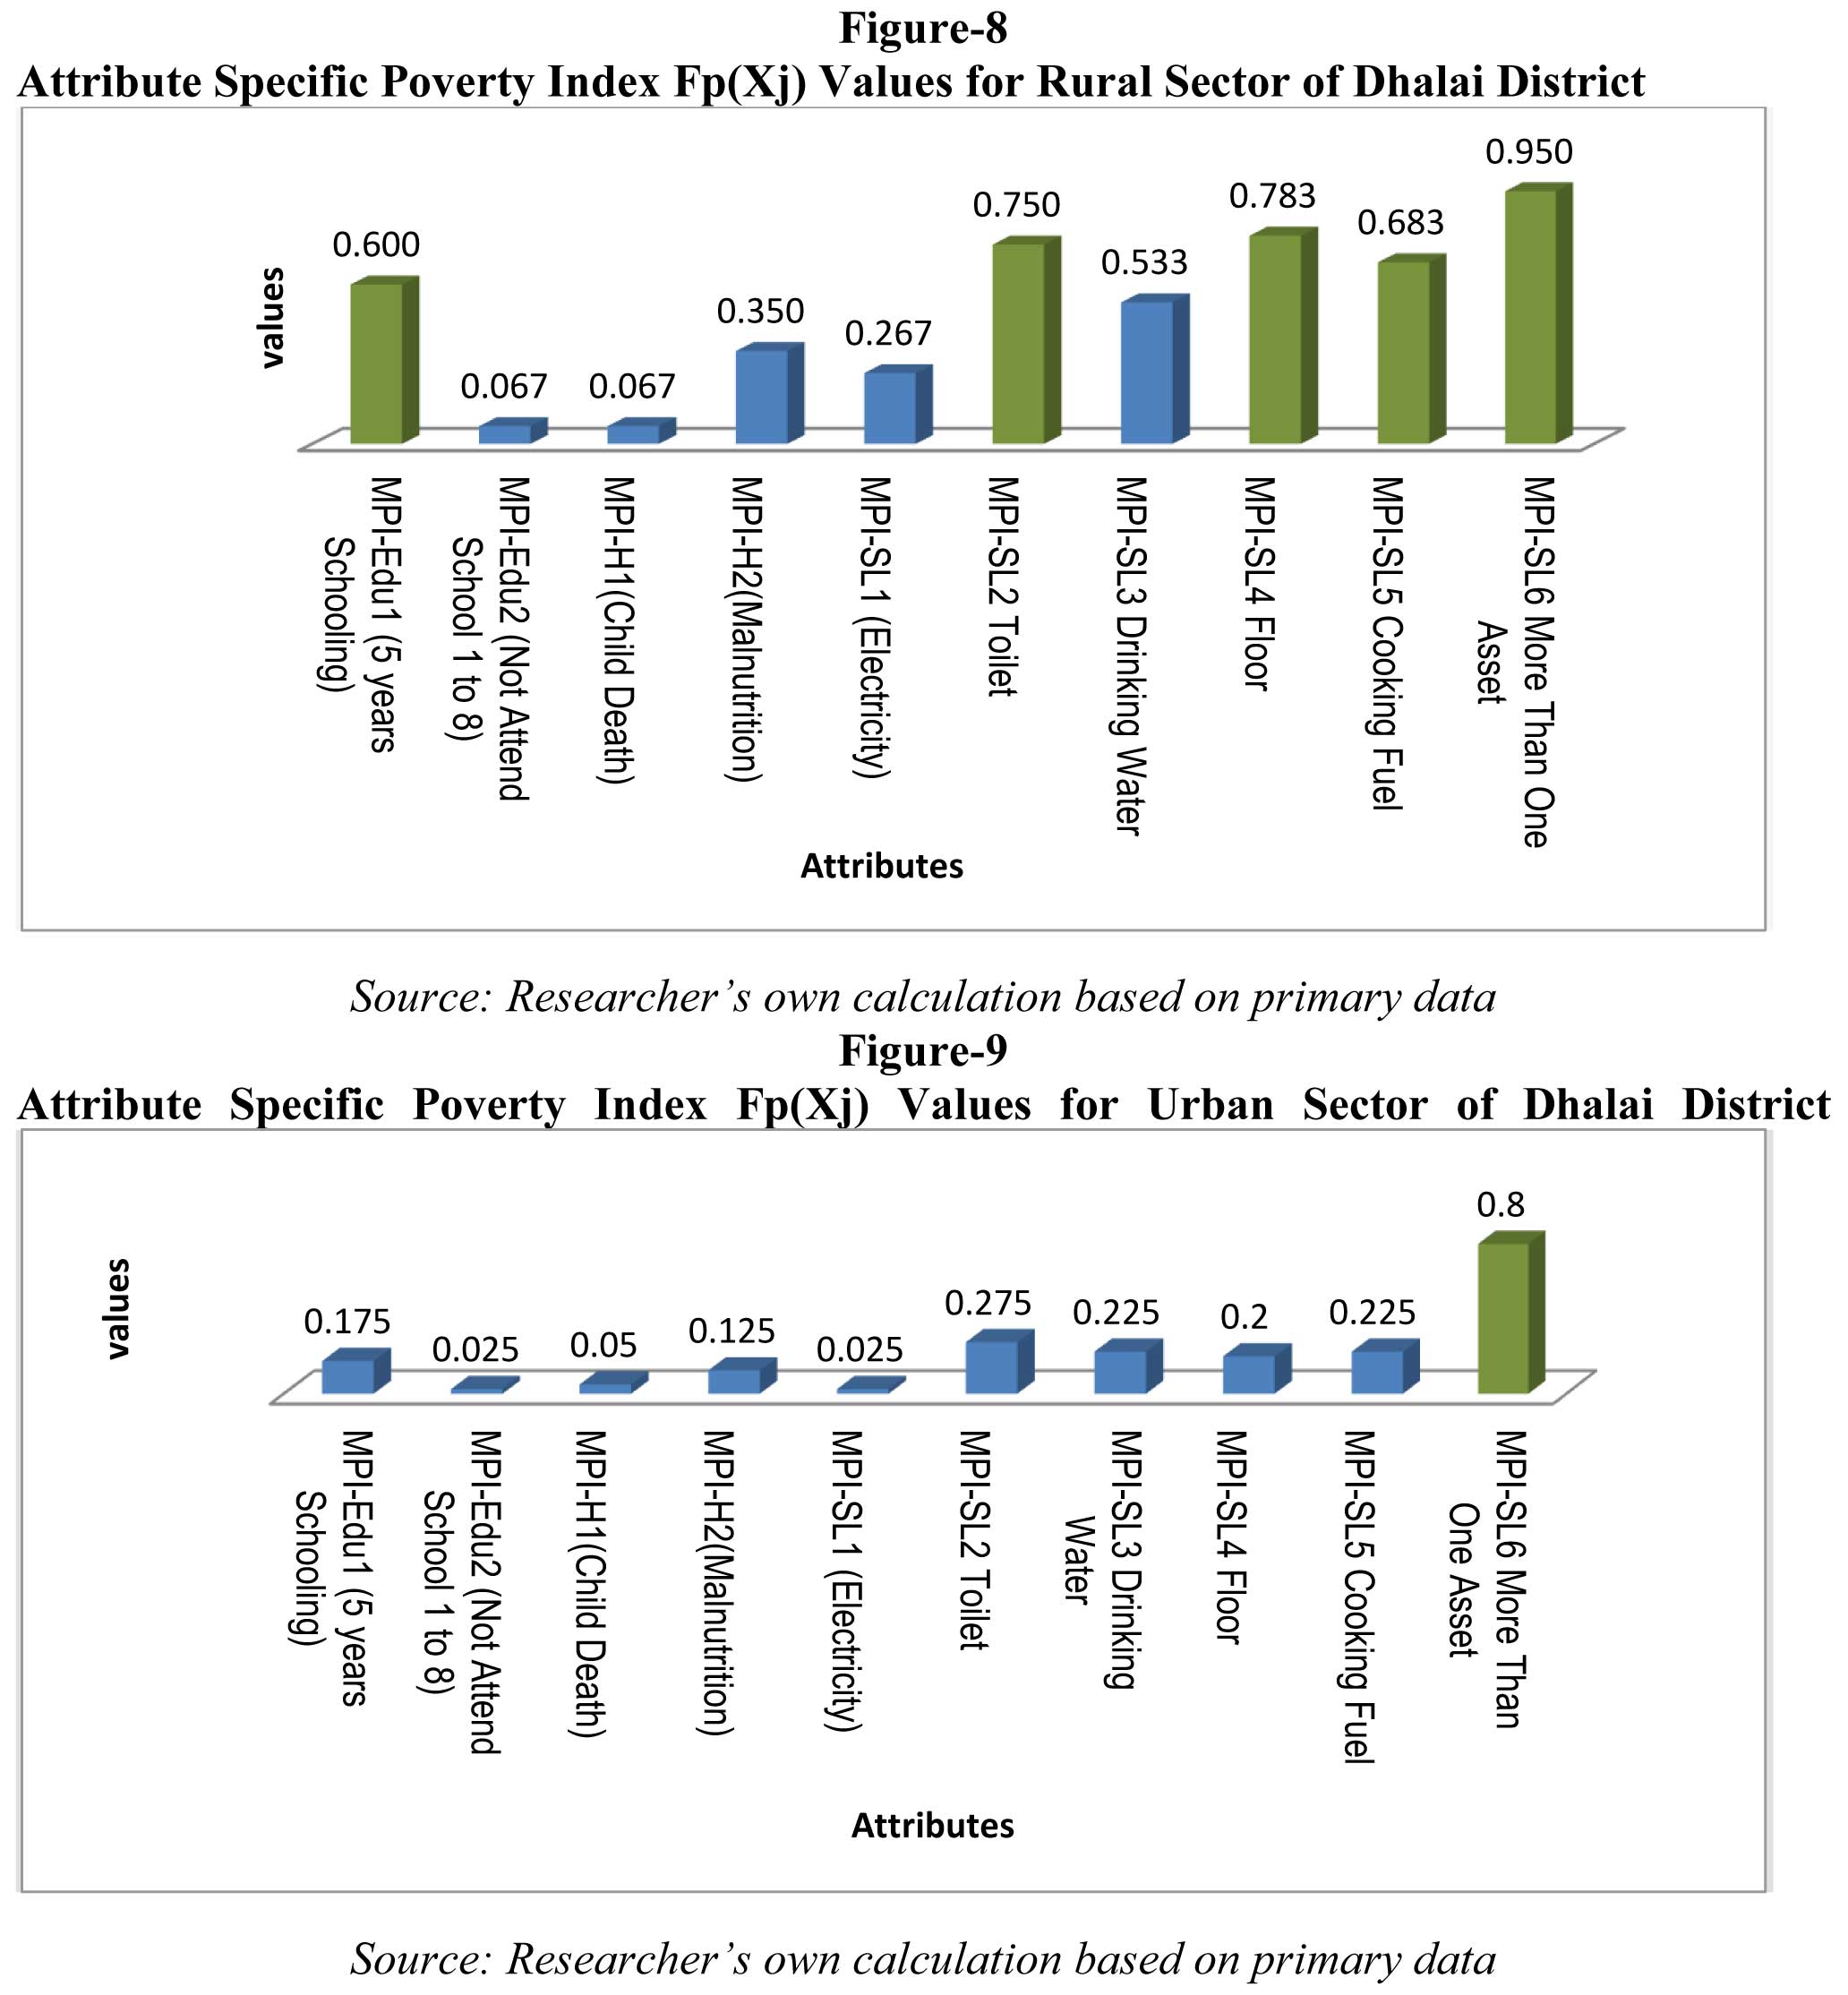
From the figure-7 we can settle with the view that among the poverty ratios by attribute that is, FP(X10) presents the maximum value which means that the more than one asset indicator appears to be the prime cause of multidimensional poverty in rural sector of Dhalai district. The condition of floor of the house emerges as the second most important cause of household poverty. It is followed bythe toilet facility. In the fourth place comes cooking fuel. The attribute concerned with the education and years of schooling attains fifth position. The attribute drinking water facility comes at sixth position. All the other indicators show presence of deprivation but not at that much alarming extent.
From the figure-5.15 we can conclude that among the poverty ratios by attribute that is, FP(X10) presents the maximum value which means that the MPI-SL6 indicator appears to be the prime cause of multidimensional poverty in urban sector of West Tripura district.
5. Conclusion
The present study is carried out to apply the Multidimensional approach to find out the severity and incidence of poverty in Tripura. The results primary data analysis of poverty measurement by applying AF-Multidimensional method of analysis, which is the second objective of this research work reveal that for rural areas of West Tripura district, 48 percent of people are MPI poor. We also learn on average the poor here are deprived in 45 percent of the weighted indicators. The value of MPI index, M0 is 0.215. The MPI represents the share of the population that is multidimensionally poor adjusted by the intensity of the deprivation suffered. This adjustment is necessary because by only looking at H one can merely know that 47 per cent of the population is poor. But all of them are not equally poor and also they are not deprived in 100 per cent of all the considered deprivations. The average poor person is deprived in 45 per cent of the weighted indicators, so the intensity is 45 percent (These are called weighted‖ indicators, because to create the deprivation score where each deprivation is entered according to its relative weight). For the rural areas of Dhalai district, 68 percent households are multidimensionally poor where on an average poor person is deprived in 55 percent of the weighted indicator, as the intensity is 55 percent. The value of M0 is 0.375. For urban areas of Dhalai it is found that 15 percent of the people are MPI and the average poor person is deprived in 45 per cent of the weighted indicators. Finally, the aggregate figure for Tripura shows that 37 percent of people are multidimensionally poor and the average poor person is deprived in 49 per cent of the weighted indicators. The final weighted index value of MPI for Tripura is 0.181. Alternative Estimation by Fuzzy Set Approach shows that out of total 120 households in rural sector of West Tripura only 1.67 percent households (2 households) fall under the category of non-poor, 90 percent households fall under the not so poor group and in total 9.16 percent households fall under either poor or very poor group. Thus there is enough evidence of poverty in rural sector of West Tripura district. The results for Fuzzy Multidimensional Poverty estimates for urban areas of West Tripura District of Tripura shows that out of total 80 surveyed households 35 percent households fall under the category of non-poor, 63.75 percent households fall under the not so poor group and only 1.25 percent households fall under very poor group. For rural areas of Dhalai District of Tripura total 60 households only 3.33 percent of households fall under the category of non-poor, 71.67 percent households fall under the not so poor group, 21.67 percent households fall under poor group and 3.33 percent under very poor group. Results for Fuzzy Multidimensional Poverty estimates for urban areas of Dhalai District of Tripura depicts that out of total 40 households 15 percent households fall under the category of non-poor, 67.50 percent households (fall under the not so poor group, 10 percent households fall under poor group and 7.5 percent under very poor group. Thus from these things became clear that there is enough evidence in support of problem poverty existing in Tripura. The district wise comparison of incidence of poverty by both types Multidimensional Poverty method shows that incidence of poverty is comparatively higher in Dhalai district for both rural and urban areas and the overall concentration of poverty is relatively higher in rural areas. Thus multidimensional poverty analysis also comes up with same sort of conclusion like money metric method. Further, the analysis regarding the extent of poverty in different dimensions of Multidimensional poverty by the analysis of attribute wise uni-dimensional poverty ratios shows that deprivation in the form of - households not having more than one asset appears to be the dominant indicator for multidimensional deprivation of households of the rural sector of the West Tripura district of Tripura in line with this the next important indicator is condition of floor which is followed by toilet facility, drinking water facility and cooking fuel. Thus for the households of the said area most of the standard of living indicators are relatively more important cause of multidimensional deprivation and poverty in rural sector of West Tripura. Even for rural sector of Dhalai district deprived in case of more than one asset - indicator appears to be the prime cause of multidimensional poverty. The condition of floor of the house emerges as the second most important cause of household poverty. It is followed by the toilet facility. In the fourth place comes cooking fuel. The attribute concerned with the education and years of schooling attains fifth position. The attribute drinking water facility comes at sixth position. All the other indicators show presence of deprivation but not at that much alarming extent. For the urban areas of indicator appears to be the prime cause of multidimensional poverty in urban sector of West Tripura district. Again, study has established that households being non-poor by income criteria are found to be multidimensionally poor and with this it can easily conclude that income alone fails to capture deprivations faced by households both in rural and urban areas. On the basis of evidences established in this work, it is recommended that the AFM should be adopted for identifying poor households for official estimates and social protection programmes in Tripura so that real picture of poverty can be depicted and mitigated.
Associating with the results of this present research work we suggest some policy recommendation as follows:
- Development policy should be targeted in proper way to the actual poor.
- More proper functioning of rural development programmes are very much required so that such policies can provide maximum possible benefits to the needed ones.
- Public Distribution should be strengthened and at present when alternative schemes have taken place of Public Distribution system, there requires smooth running of these new systems.
- Suitable steps are needed to meet the basic needs like safe drinking water and better sanitation of poor.
- The solution to income poverty is income and employment. Thus more employment generating activities are required to be generated.
- Additional children in household decreases the level of household savings and per capita income and with this there remains possibilities of low per capita food consumption and lead to malnutrition problem.
References:
- Ali, I., Saboor, A., & Ahmad, S. (2010). Relative poverty dynamics in Pakistan. Pakistan Journal of Agricultural Sciences, 47(1), 45-52.
- Alkire, S. (2005). Valuing freedoms: Sen's capability approach and poverty reduction. Oxford University Press on Demand.
- Alkire, S. (2007). The missing dimensions of poverty data: Introduction to the special issue. Oxford development studies, 35(4), 347-359.
- Alkire, S., & Foster, J. (2008). Counting and Multidimensional Poverty Measures “OPHI Working Paper Series (7).
- Alkire, S., & Foster, J. (2011). Counting and multidimensional poverty measurement. Journal of public economics, 95(7), 476-487.
- Alkire, S., & Foster, J. (2011). Understandings and misunderstandings of multidimensional poverty measurement. The Journal of Economic Inequality, 9(2), 289-314.
- Alkire, S., & Santos, M. E. (2010). Acute multidimensional poverty: A new index for developing countries. United Nations development programme human development report office background paper, (2010/11).
- Alkire, S., & Santos, M. E. (2010). Acute multidimensional poverty: A new index for developing countries. United Nations development programme human development report office background paper, (2010/11).
- Asselin, L. M., & Dauphin, A. (2001). Poverty measurement: a conceptual framework. Canadian Centre for International Studies and Cooperation, CECI. Québec. En: http://www. pep-net. org/fileadmin/medias/pdf/asselin/Poverty. pdf [Diciembre 3 de 2010].
- Cerioli, A., & Zani, S. (1990). A fuzzy approach to the measurement of poverty. In Income and wealth distribution, inequality and poverty (pp. 272-284). Springer Berlin Heidelberg.
- Dagum, C., & Costa, M. (2004). A fuzzy approach to the measurement of poverty. C. Dagum & G. Ferrari (eds.)(Eds.), Income and wealth distribution, inequality and poverty, 272-84.
- Directorate of Economics & Statistics Planning (Statistics) Department (2014).Economic Review of Tripura 2013-14.Government of Tripura, Agartala.
- Government of Tripura. (2007). Tripura Human Development Report.
- Himanshu. (2007). Recent trends in poverty and inequality: some preliminary results. Economic and political weekly, 497-508.
- Ministry of Rural Development. (2011). SOCIO ECONOMIC & CASTE CENSUS 2011IN RURAL India, Government of India.
- Ministry of Statistics and Programme Implementation Government of India. (2007). Energy Sources of Indian Households for Cooking and Lighting, 2004-05 NSS 61st Round (July 2004 - June 2005). Government of India.
- Planning Commission. (2012). Press Note on Poverty Estimates, 2009-10. Government of India.
- Planning Commission. (2013). Press note on poverty estimates, 2011-12. New Delhi: Planning Commission, Government of India.
- Planning Commission. (2014). Report of the Expert Group to Review the Methodology for Measurement of Poverty (June, 2014).Government of India.
- Ram, F., Mohanty, S. K., & Ram, U. (2009). Understanding the distribution of BPL cards: all-India and selected states. Economic and Political Weekly, 66-71.
- Sundaram, K., & Tendulkar, S. D. (2003). NAS-NSS estimates of private consumption for poverty estimation: A further comparative examination. Economic and Political Weekly, 376-384.
- Sundaram, K., & Tendulkar, S. D. (2003). Poverty among social and economic groups in India in 1990s. Economic and Political Weekly, 5263-5276.