Subscribe now to get notified about IU Jharkhand journal updates!
Exploring the role of perceived level of difficulty in preference for Project Success Criteria among professionals
Abstract :
Research on project success and stakeholder management suggests that success perceptions for projects among stakeholders show major relative variations; these variations can largely be attributed to the criteria each stakeholder considers in evaluating the project. Stakeholders consider different success criteria in their evaluation based on their interest/involvement in the particular project, their understanding of the project and outcomes among others. This paper explores the association between the ‘preference for success criteria’ among professionals to its ‘perceived level of difficulty to achieve’ and concludes that there is indeed a positive correlation between the two factors for some criteria. A relatively weak correlation between the variables is observed after analysis using both traditional methods and polychoric correlations. The paper fails to establish that the relation applies to all success criteria.
Keywords :
Project Success, Success criteria, Perceived difficulty level, Polychoric correlation, Bayesian analysis, ordinal factor analysis1. Introduction
Assessments on success of projects habitually consider performance in terms of time, cost and quality as the main success criteria. Inadequacy of considering the “iron triangle’ alone in project success evaluation is well documented (Atkinson, 1999) but the subjective nature of success criteria (Villalba-Romero & Liyanage, 2016)makes it relatively complex. Projects have multiple stakeholders and the success criteria each stakeholder uses in judging success may have a bearing on their interests in the specific project. Success criteria preference levels and the perceived level of difficulty for selected criteria among professionals is analysedin this paper to explore a possible relationship between the two variables and tests whether the preferencesfor project success criteria amongproject professionals in India is based on their perceived difficulty level for achieving such criteria.
Project Success, Success Criteria and Project Life-cycle
Research on Project success is progressing for several decades and newer perspectives on projects and their success are reported by researchers worldwide.(Baker, Fischer, & Murphy, 1974) studied effectiveness of projects to determine those factors which affect project performance and to distinguish between those factors which improve success and those which cause failure.Research on project success during seventies to eighties considered project success in terms of achievement of management factors. (Atkinson, 1999) states that Project performance over the years is habitually measured in terms of the management factors referred to as “iron triangle” comprising cost, time and quality factors. The notion during early years was that if the project finished on time, near the budget cost and performed as envisaged, it was considered successful. Considerations like client satisfaction came into picture later(Pinto & Slevin, 1988). Researchers all over the world have differentiated project success from success of project management process and pointed to the fact that an overall success in the project management process does not ensure a successful project and that poor performance in terms of project management performance measurement need not indicate a project failure(de Wit, 1988; Munns & Bjeirmi, 1996). Project success is a multidimensional construct that includes both the short-term project management success efficiency and the longer-term achievement of desired results from the project, that is, effectiveness and impact.(Jugdev& Thomas, 2001)
The classification of a project as a success or a failure is, to a degree, subjective (Ika, 2009). (Müller & Jugdev, 2012)describe project success as “predominately in the eyes of the beholder” meaning one stakeholder may consider a project successful, where another stakeholder would consider it a failure. Morris and Hough define success criteria as the measures used to judge the success or failure of a project; these are dependent variables that measure success(Joslin & Müller, 2014).Success Criteria as metrics used to evaluate the success of projects includes both tangible and intangible criteria. Success criteria refer to the measurement of project success whereas success factors refer to the those inputs to management system that lead directly/ indirectly to the success of project/ business.(Cooke-Davies, 2002). Hard factors like cost, time, quality are relatively easy to measure. Soft factors like happiness, job satisfaction, enhanced reputation are subtle and difficult to measure.(Baccarini, 1999). Success of project means different things for different people(Shenhar, Dvir, Levy, & Maltz, 2001). The criteria for success of the project management effort tends to be restricted to cost, time and quality performance. When measuring project success, one must consider the objectives of all stakeholders throughout the project life cycle and at all levels in the management hierarchy(de Wit, 1988). Baccarini states that project management success is measured in terms of internal factors (cost-time-quality) whereas achieving product success is concerned with project’s external effectiveness. Product success is of higher order, project management success is subordinate to product success.(Baccarini, 1999). Delivering project success is more difficult than delivering project management success. Goals and methods are liable to change whereas project management success is based on predetermined goals(Cooke-Davies, 2002). Research on project success further shows that it isimpossible to generate a universal checklist of projectsuccess criteria suitable for all projects. Success criteriawill differ from project to project depending on a numberof issues, for example, size, uniqueness and complexity(Wateridge, 1998).(B. A. Hussein, 2013) views that research into project success criteria in projectmanagement literature can be grouped into three major classes –clusters of success criteria, the rational fordefining success criteria and risk factors associated with success criteria
According to(de Wit, 1988), ‘The most appropriate criteria for success are the project objectives. The degree to which these objectives have been met determine the success of the project’. de Wit adds further that though it appears simple multiple project objectives and multiple project stakeholders makes the issue really complex. Some researchers suggested that project success criteria should be specific to each project and that they should therefore be determined by stakeholders at the start of each project.
Success Criteria and its importance varies along the project life-cycle.The emphasis on what is important in a project, changes from one phase of the project to the next(de Wit, 1988). (Shenhar & Wideman, 1996) classifies success criteria along four time- scales along the project life cycle from the pre-completion to extended lifespan as Internal Project Objectives (Pre-completion), Benefit to Customer (Short term), Direct Contribution (Medium term) and Future Opportunity (Long term) with multiple criteria under each category.
Differences in approaches, values and expectations between customers, suppliers and team members with different cultural backgrounds have led to many project failures(Laroche, Ph, & Eng, 1998). The choice or preference for success criteria even for same type of projects shows variations due to many subjective factors like cross cultural differences, beliefs, values etc.
Association among Ordinal Variables
The variables used in many empirical studies in the social and behavioural sciences are often ordinal rather than continuous. Observations on an ordinal variable are assumed to represent responses to a set of ordered categories such as a five-category Likert scale.(Yang-Wallentin, Jöreskog, & Luo, 2010). Ordinal variables are not continuous variables and should not be treated as if they are. Ordinal variables do not have origins or units of measurements. Means, variances, and covariances of ordinal variables have no meaning. The only information we have are counts of cases in each cell of a multiway contingency table(Jöreskog, 1994). Ordinal data do not provide metrical information and, therefore, one needs to analyse frequency information in a contingency table(Choi, Peters, & Mueller, 2010).(Choi et al., 2010), opines that instead of treating ordinal data as if they were continuous (or metrical), several alternative correlational methods have been developed for ordinal data, such as Spearman’s ρ, Kendall’s τ, and polychoric correlations(Olsson, 1979).
Spearman and Pearson correlation coefficient, Gamma coefficient, Kendall's tau-b, Kendall's tau-c, and Somers' d are the most commonly used measures of association for doubly ordered contingency tables. Quoting Garson, When there are two categorical variables that are both naturally ordered, a variety of effect size measures have been proposed for such ordinal data, including Gamma coefficient, Kendall's tau-b, Kendall's tau-c, and Somers' d(Göktaş& İşçi, 2011). Four measures arising from excluding or including ties on 2 ordinal variables are Goodman & Kruskal's G, Somers's dr~ , Kim's d~.x, and Wilson's e…. when both variables contain some ambiguousties, (Goodman & Kruskal, 1954) G should be used. (Gonzalez & Nelson, 1996).
Kendall's tau (Kendall, 1938) and Spearman's rho (Spearman, 1904) are two commonly used nonparametric methods of detecting associations between two variables. Tau and rho are closely related; they are both functions of the ranks(Taylor, 1987)Unlike Kendall’s s and Spearman’s q, polychoric correlations, similar to Pearson’s r, assume an underlying bivariate normal distribution, capture the linear dependency between two underlying variables and can be used in many other statistical applications.(Choi et al., 2010)
Study Objective
The objectives of this study are:
- To examine whether the level of preference for success criteria is influenced by the perception about the level of difficulty in achieving the particular criteria.
- To probe for any underlying factors based on the success criteria preferences.
Hypotheses
H1 – Level of Preference for success criterion is unrelated to the perceived level of difficulty in achieving the criteria
H1A - Perceived level of difficulty in achieving the success criteria impacts the level of preference for the success criterion.
H2 – In case H1 fails, the impact of perceived difficulty in achieving the criteria on level of preference for the success criterion is relatively insignificant. (r <0.25).
H2A - Perceived level of difficulty in achieving the success criteria has significant impact on the level of preference for the success criterion. (r >=0.25)
Methodology and Analysis
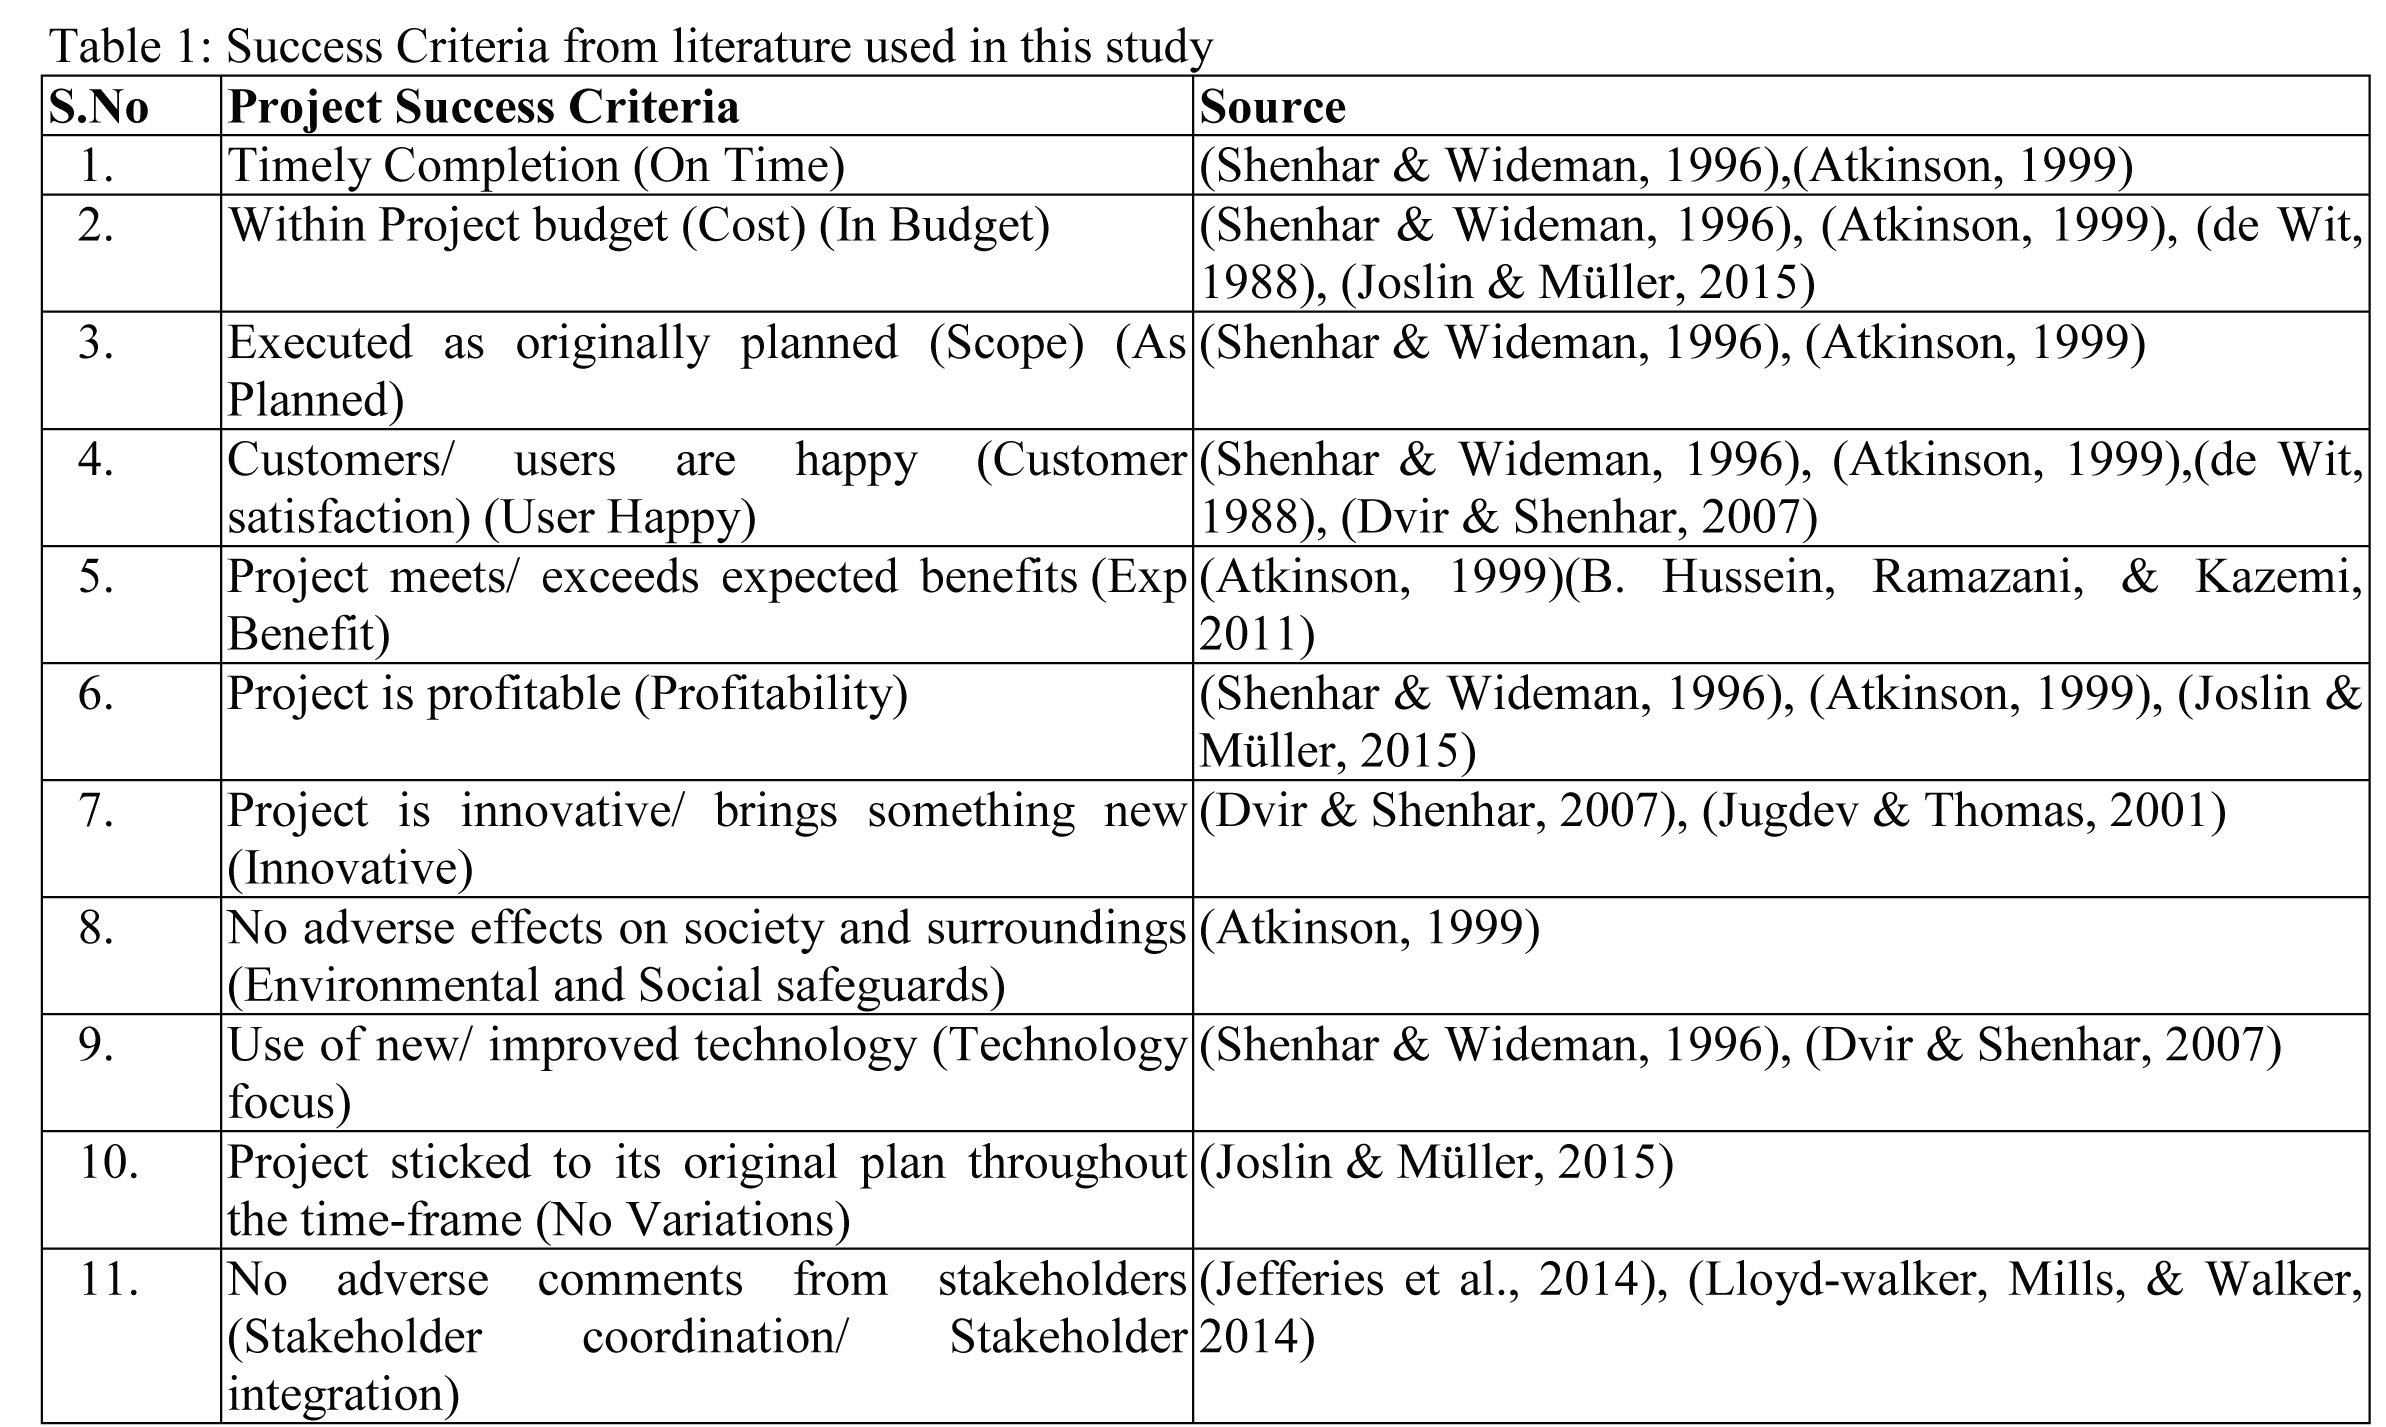
The analysis framework for the study comprises a set of eleven project success criteria obtained from literature. Table 1below gives the eleven success criteria used in this study and the reference literature source for each. The questionnaire enables respondents to select their level of preference as well as the perceived level of difficulty to achieve rating for each of the above eleven success criteria, respondent work profile is also captured. Qualitative rating for the ‘level of importance’ and ‘perceived level of difficulty to achieve’ for the success criteria on a four-point categorical/ ordinal scale is used. Questionnaire is supplied online to professionals from various work streams to collect their responses. Convenience sampling is used. The possibility of a relation between the two variables was proposed in some earlier studies(Kothandath, 2018).
For each of the above eleven success criteria, permitted responses for all variables for both the level of importance and level of difficulty are HIGH, MEDIUM, LOW and NA. These responses are coded 1, 2, 3 and 4 respectively. Blank response for some criteria indicates that the particular success criteria is not considered important by the respondent in measuring success of project.
Analysis is conducted to check the possible association between perceived difficulty in achievement to the preference for any particular success criterion. The study uses descriptive statistics, different methods of correlation analysis and ordinal factor analysis. Scale reliability along with reliability for individual variables is checked and cross tabulation of the variable pairs corresponding to each criterion performed, Somers' d and Goodman and Kruskal Gamma computed to measure the level of association, the values compared with two more correlation coefficients viz., Kendall’s Tau and Spearman’s rho.
Correlation coefficients corresponding to each of the success criteria was computed for each variable pair of ‘Level of Importance’ and ‘perceived level of difficulty’. Both conventional methods for computing correlation coefficients of ordinal variables as well as new analysis techniques were adopted. The above methods use the frequency distribution between the variables of the ordered pairs to compute the correlation coefficients.
Polychoric Correlation
One analysis option often employed in educational and psychological domains is to hypothesize an underlying metrical variable that is associated with the observed ordinal data(Choi et al., 2010). For each ordinal variable z, it is assumed that there is an underlying continuous variable z∗. This continuousvariable z∗ represent the attitude underlying variable z∗ can be used in structural equation modelling, not the observed variable z. The underlying the ordered responses to z and is assumed to have a range from −∞ to +∞(Jöreskog, 1994).
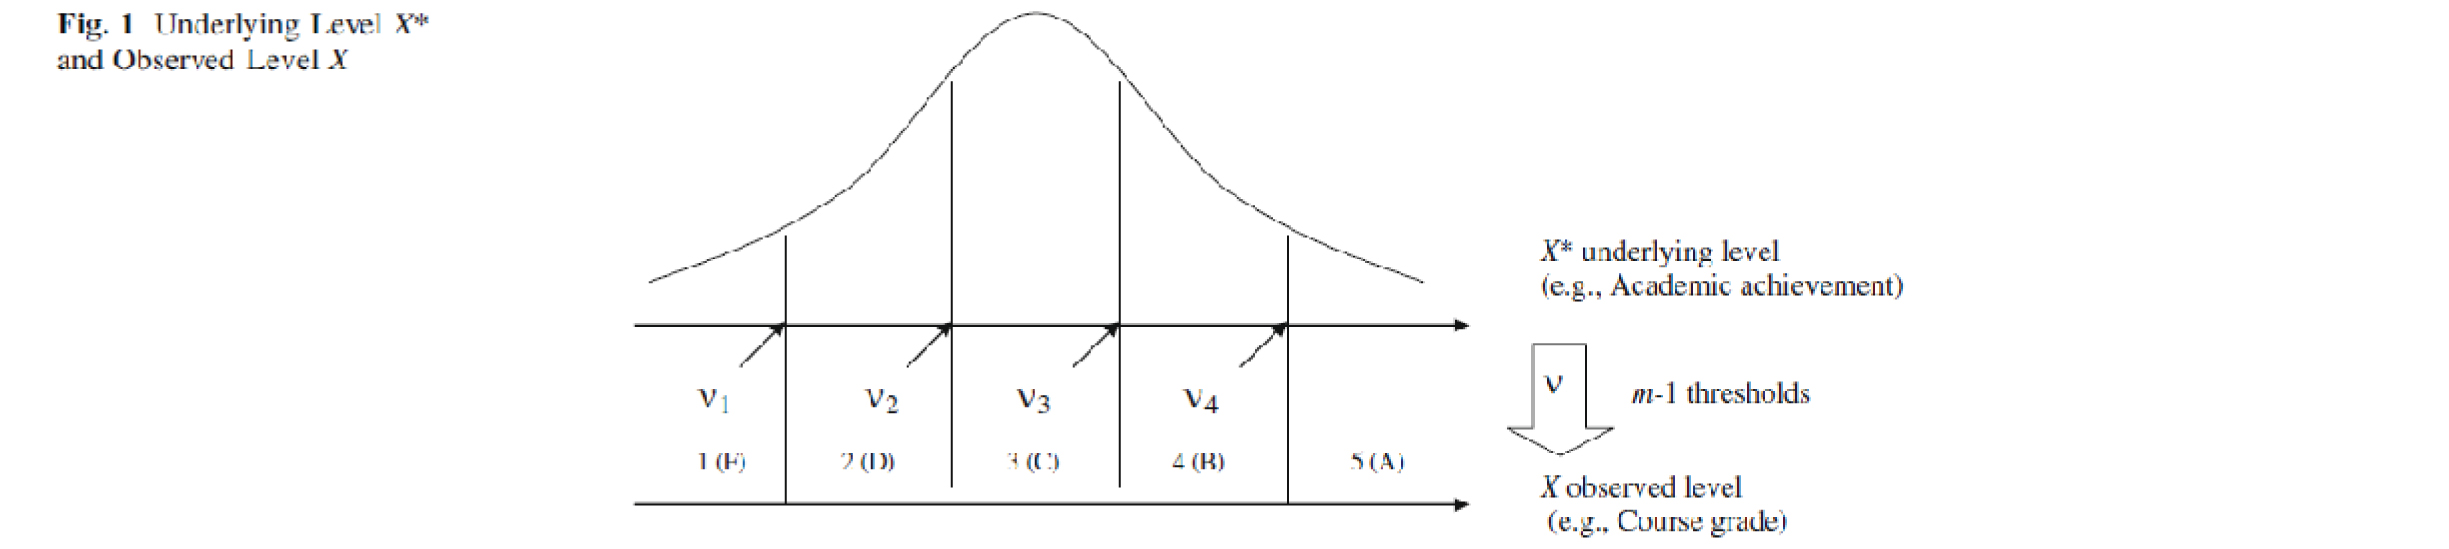
Figure 1: Underlying Level X* and Observed Level X, Source: (Choi et al., 2010)
As can be seen in Fig. 1, the relation between the underlying variable, X*, and the m-category ordinal data, X, can be established by determining thresholds, Vi. A correlation between two sets of ordinal data is assessed by extending the univariate case described in the previous paragraph to a bivariate scenario and estimating the polychoric correlation between the two respective metrical underlying variables(Choi et al., 2010). Polychoric correlation methods generally used are maximum likelihood (ML)and expected a posteriori (EAP), EAP being a Bayesian analysis. The estimation technique that one chooses to calculate polychoric correlations will impact the sample size requirements. The traditional maximum likelihood estimation method requires large sample sizes, while the EAP estimation for polychoric correlations can have stable estimates of this correlation even when sample sizes are small (e.g., smaller than 30).(Choi et al., 2010)
Results
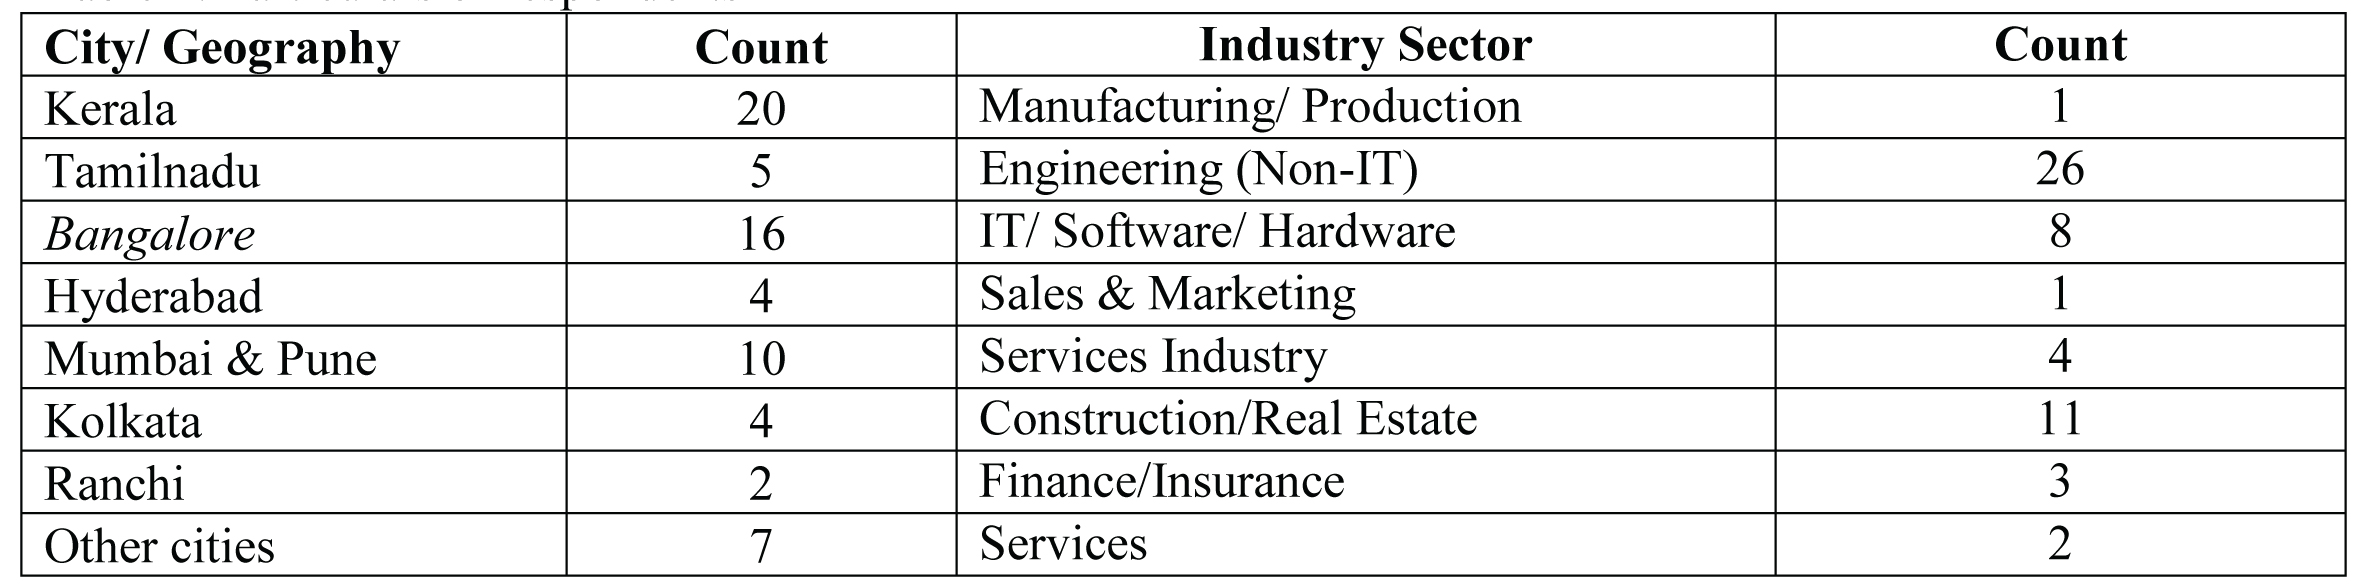
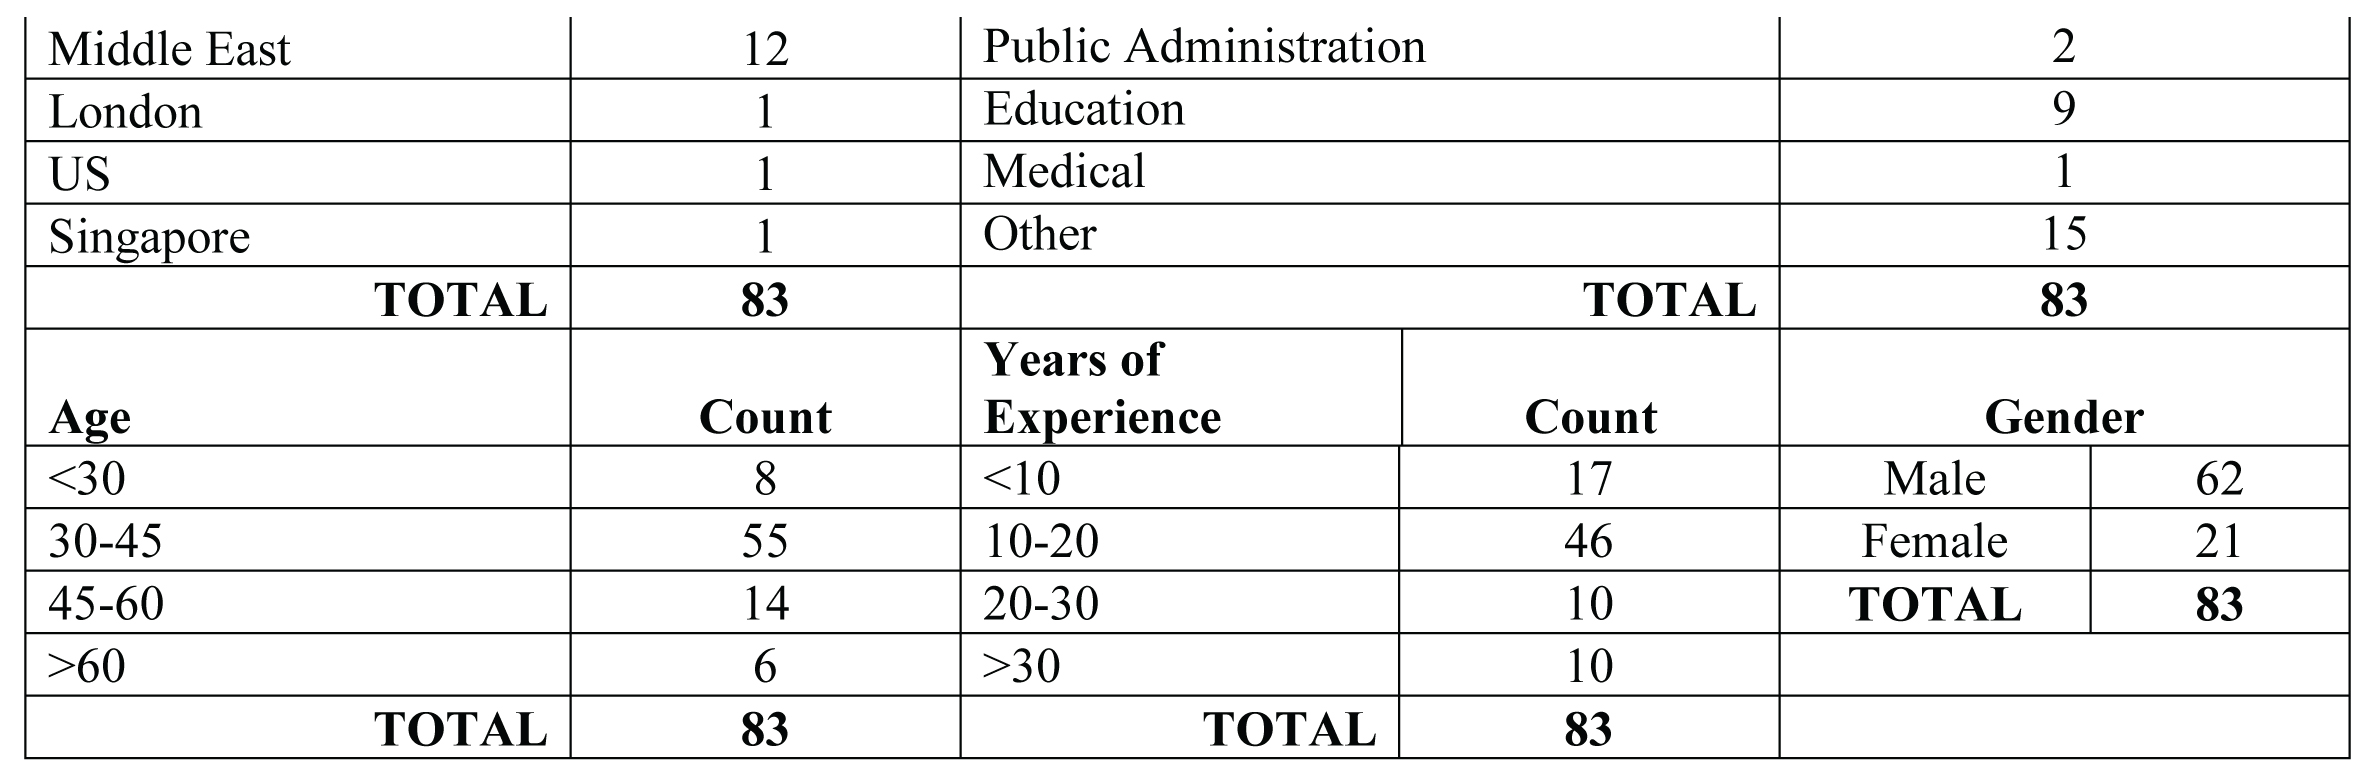
A total of 84completedresponses obtained of which 76 are usable after separating incomplete responses prior to the analysis. Respondents belong mostly to South Indian states including expatriate professionals from the region and lesser respondents from other cities. Details of respondent particulars is provided in Table 2below:
Reliability Test
Reliability statistics for scale is verified by computing Cronbach ά and McDonalds ω, the respective values are 0.880 and 0.882. Considering presence of missing values for some criteria due to respondent preferences, reliability of individual variablesis verified. Cronbach -alpha values range between 0.870 to 0.885 whereas McDonalds ω values vary from 0.873 to 0.881.
Cross tabulation and Correlation Coefficients
Cross tabulation is performed for the ordinal variables using SPSS 17 package and association coefficients Somers’ D and Gamma computed for the 11 variable pairs. The values of Somers’ D vary between -0.081 to 0.402 whereas Gamma values vary between -0.12 to 0.594. It can be seen that in the case of 7 out of 11 criteria, the level of significance is below .05 of which two criteria have significance level below 0.01 for both the coefficients. For the remaining four criteria viz., Within Budget, As Originally Planned, Users are Happy and Sticked to original plan throughout timeframe, both the coefficients are relatively low (-0.081 to 0.196 for Somers’ D and -0.12 to 0.297 for Gamma) and significance values above .05.
Kendall’s Tau and Spearman’s rho
Bivariate Correlation analysis for the variable pairs was carried out using SPSS 17. Since the variables are both ordinal ordered pairs, Pearson’s correlation coefficient is not suitable. Spearman’s Coefficient (rho) and Kendall’s tau-b was computed. Two-tailed test of significance checked for both the coefficients. Table 3 gives a comparison of the four correlation coefficients discussed above. It could be observed from Table 3 that correlation coefficients for association between level of preference and perceived level of difficulty is greater than 0.25 at 0.05 significance level for the seven criteria viz., On time, Meets expected benefits, Profitable, Innovative, No adverse effects on society and surroundings, Use of new technology and No adverse comments from stakeholders whereas for the remaining four criteria, the coefficients are too low or not significant. The correlation coefficient values vary between 0.263 to 0.402 for tau-b and between 0.283 to 0.436 for Spearman’s rho, correlations significant at 001 for two criteria and at 0.05 level for balance five criteria. In the case of remaining four success criteria, correlation values are low, the level of significance is not within acceptable limits.
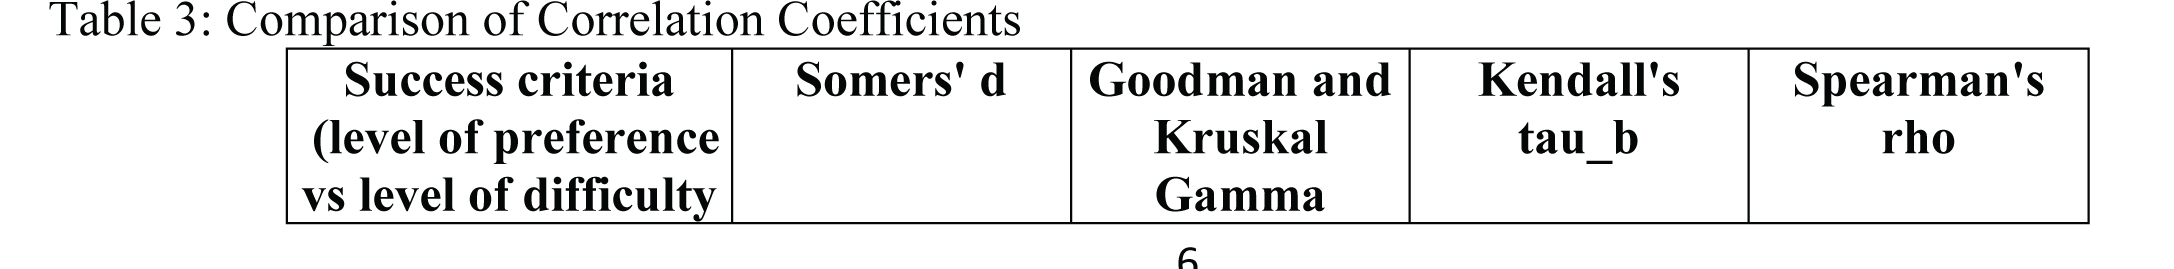
The above results support the presence of correlation between the variables and suggests impact of perceived level of difficulty for success criteria on its level of preference. Regarding the strength of correlation, though 7 of the 11 factors show significant correlation coefficients above 0.25, five of the correlation coefficients have values between 0.25 and 0.3. There is need for further investigation on the level of correlation. Moreover, Unlike Pearson’s r, Spearman’s ρ and Kendall’s τ are nonparametric measures of association and have not been extended to further analyses. Consequently, both are fairly limited as a measure of association. On the other hand, polychoric correlations possess desirable properties similar to Pearson’s r(Choi et al., 2010).
Polychoric Correlation Coefficient
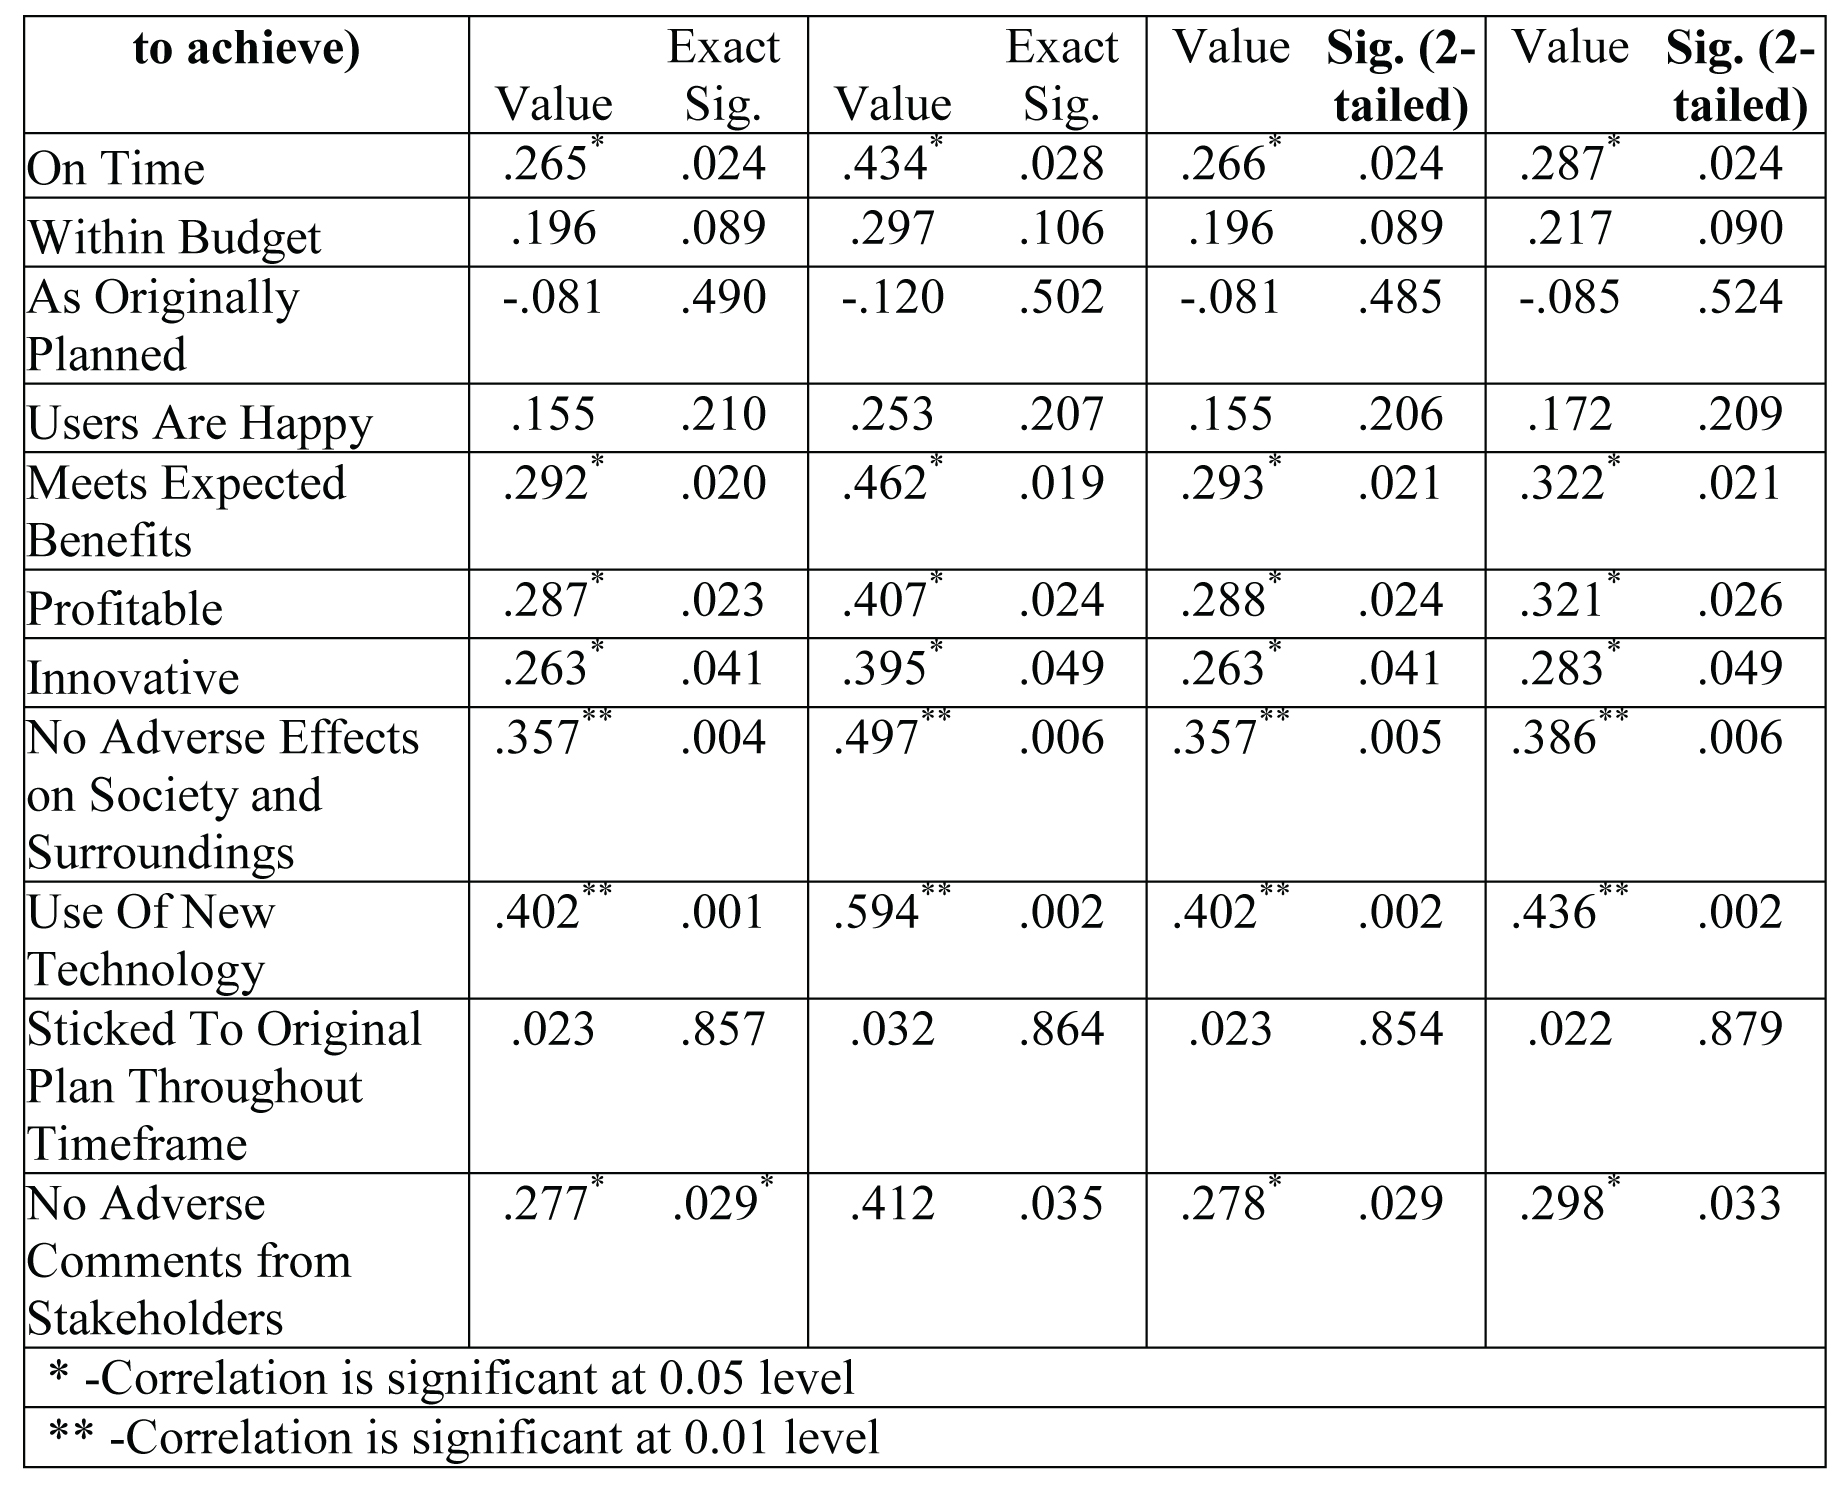
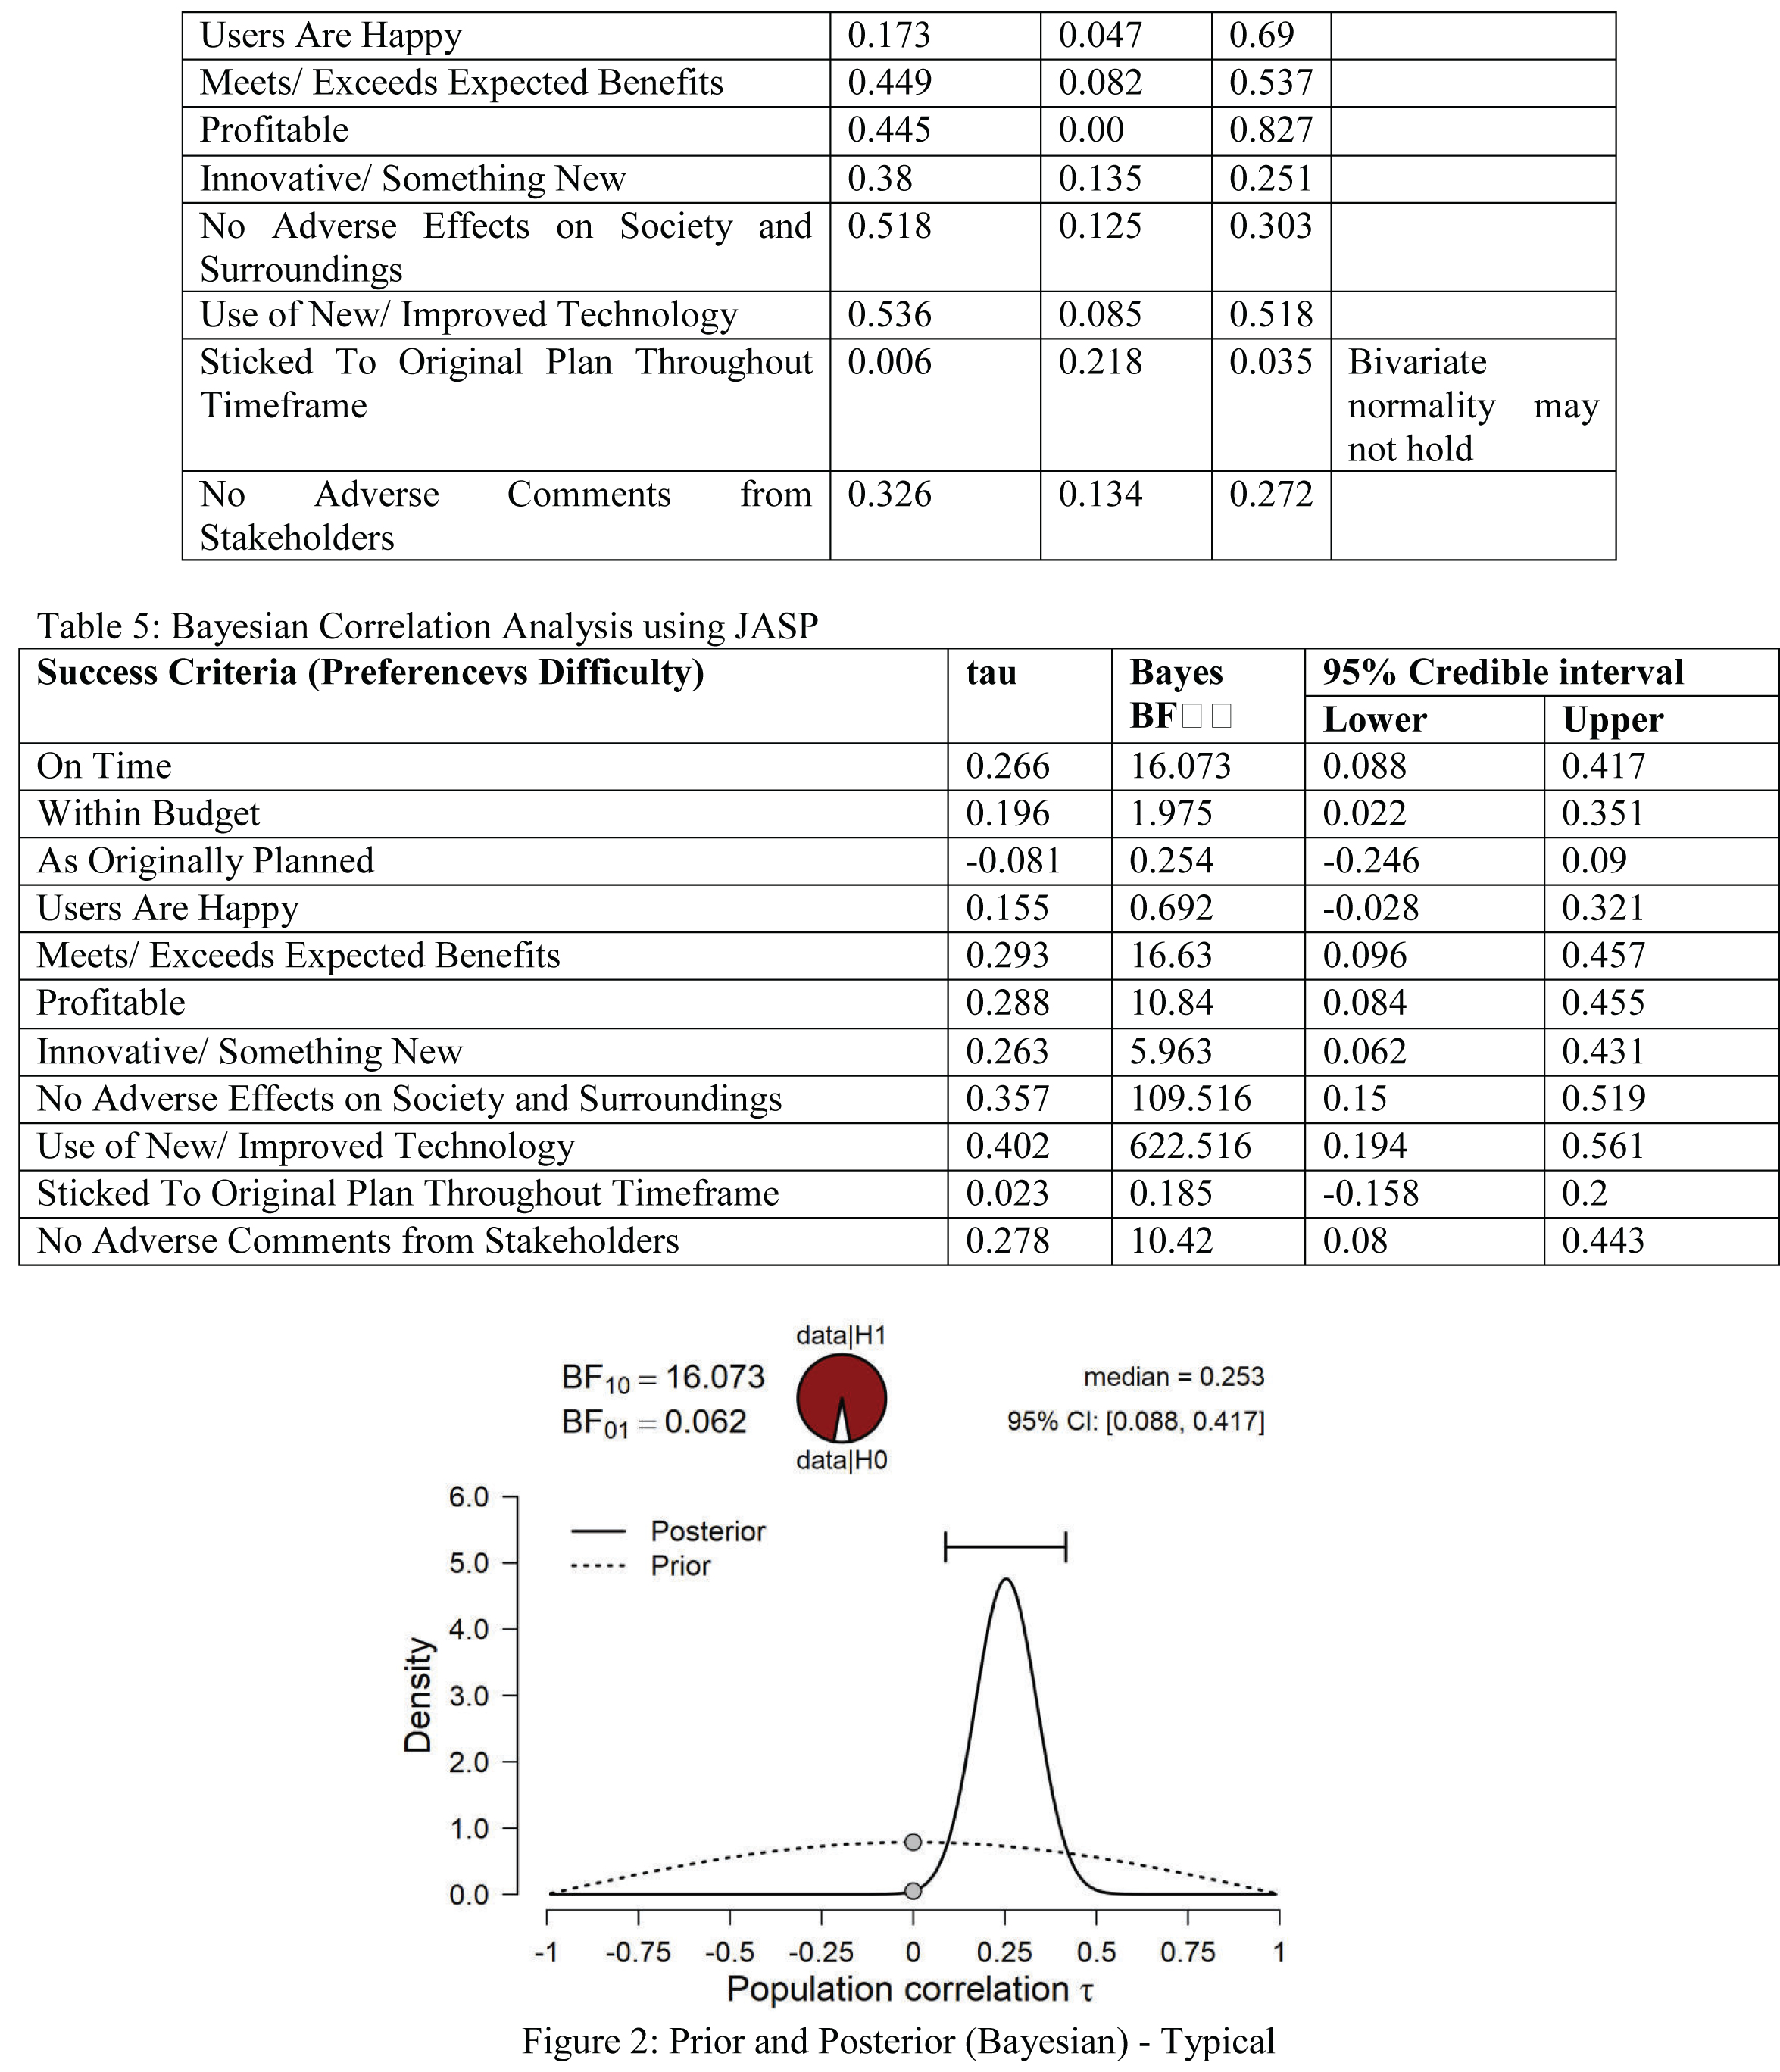
Polychoric Correlation analysis was performed for the variable pairs, both using maximumlikelihood (ML)andusing Bayesian analysis. Analysis using Maximum likelihood (ML) method was performed using LISREL package in line with the methodology suggested for analysis of ordinal variables(Jöreskog, 1994; Jöreskog & Moustaki, 2001) Bayesian analysis was carried out using JASP. Results of ML method and Bayesian analysis are shown in Table 5 and Table 6 respectively.
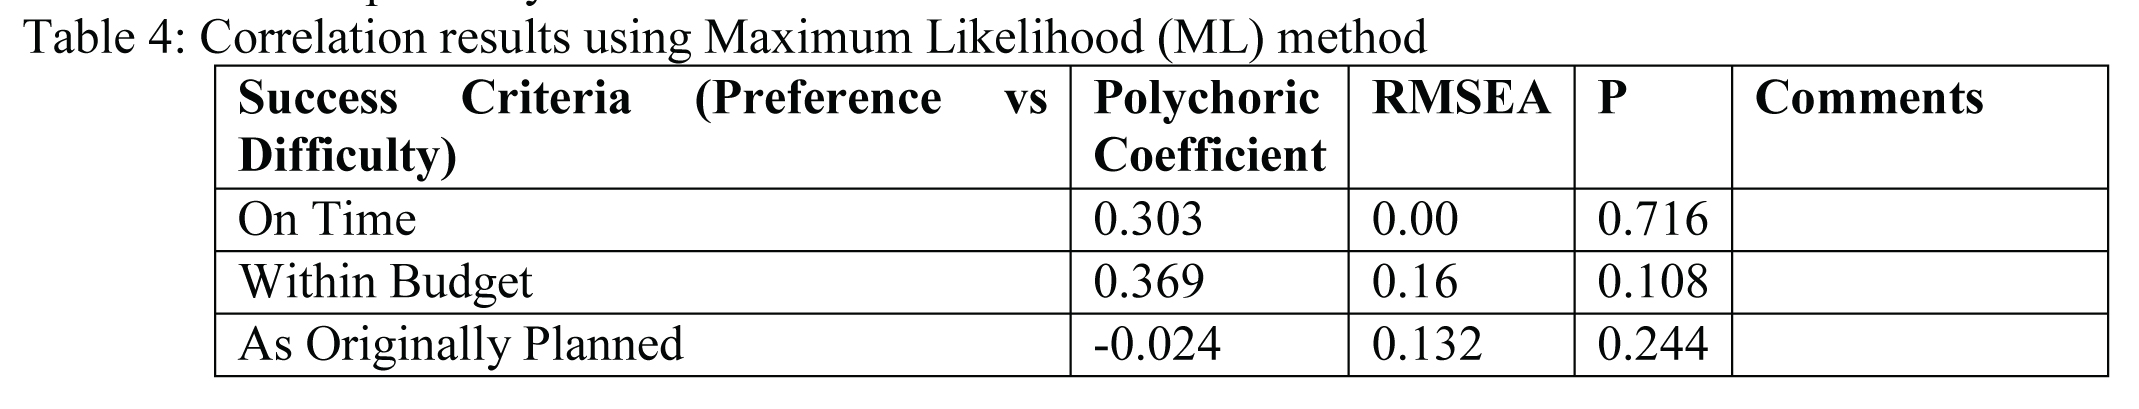
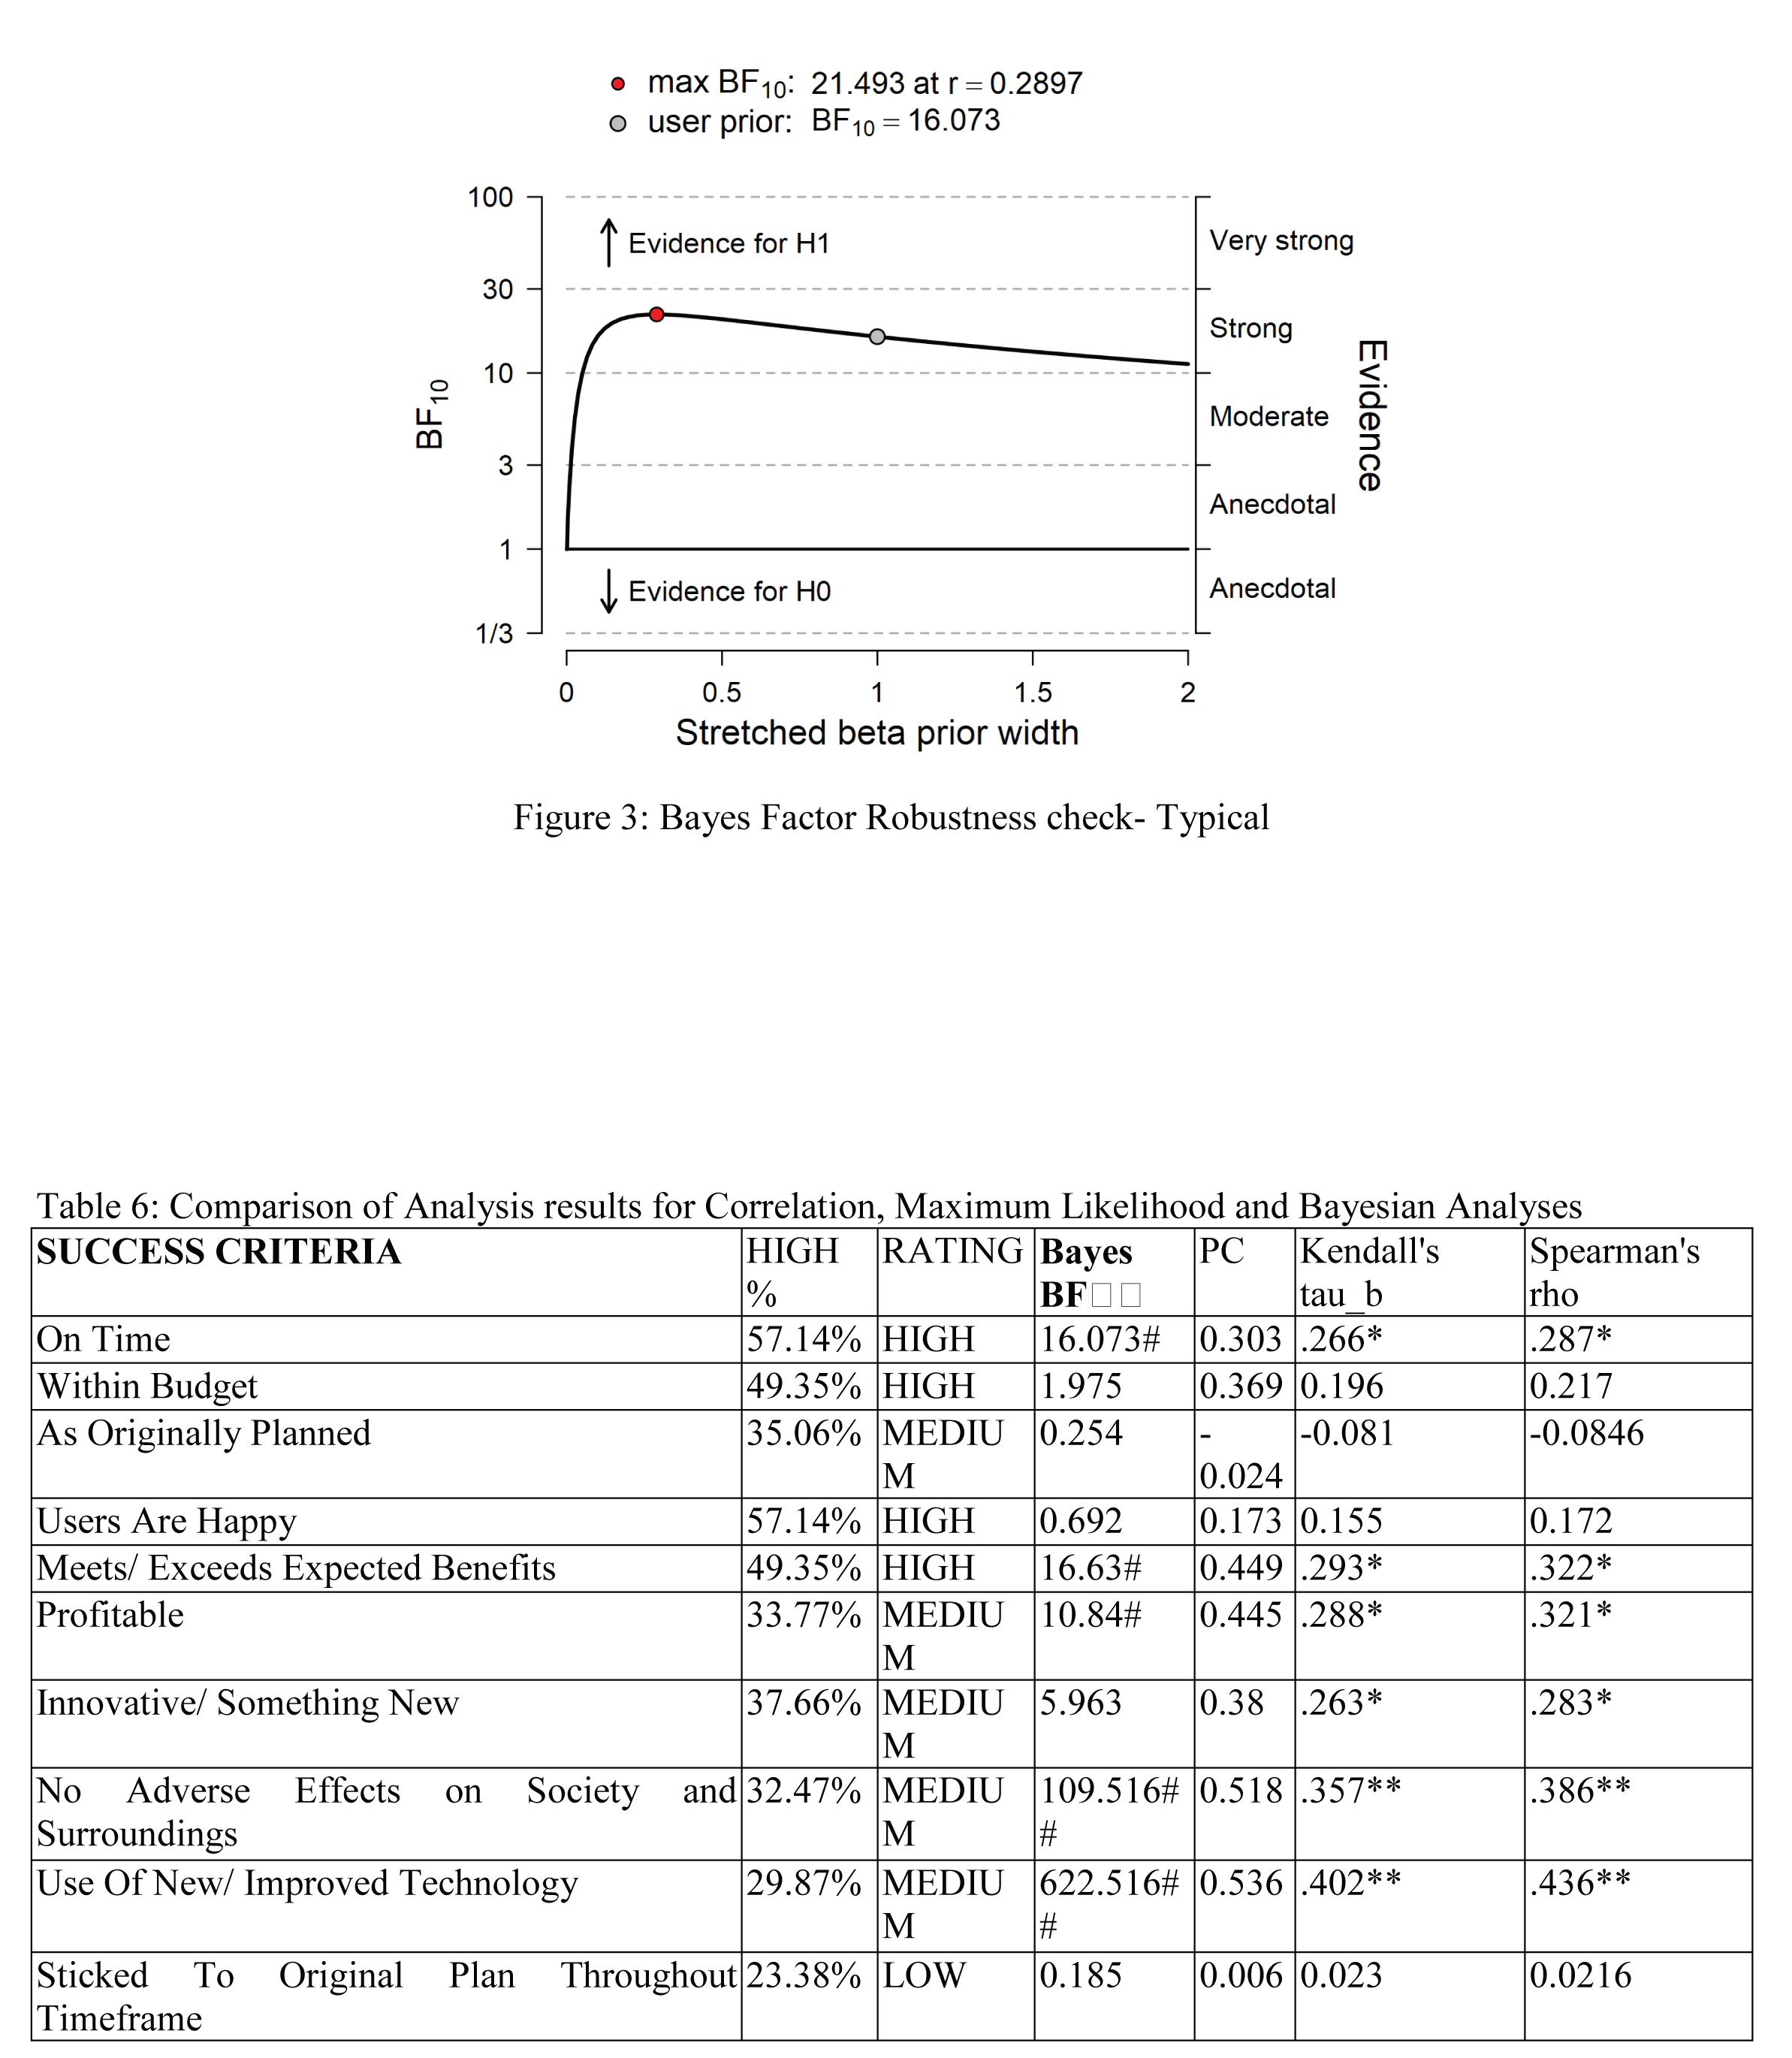
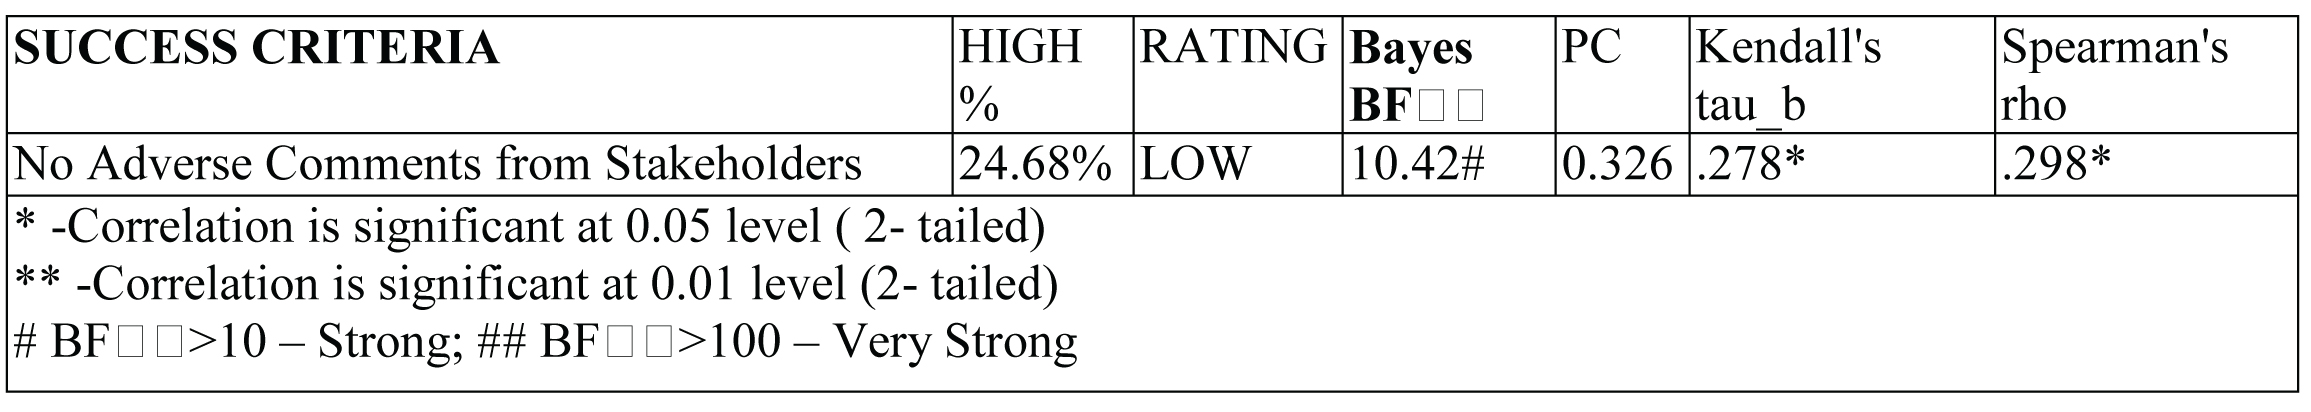
It could be observed from Table 7 that in the case of seven success criteria(On Time, Within Budget, Meets/ Exceeds Expected Benefits, Profitable, Innovative/ Something New, No Adverse Effects on Society and Surroundings and Use Of New/ Improved Technology). , the correlation coefficient values are above 0.25 whereas for the remaining four (As Originally Planned, Users Are Happy, Sticked To Original Plan Throughout Timeframe and No Adverse Comments from Stakeholders), correlation coefficients are below 0.25.
Conclusion
Analysis of level of preferences for the eleven success criteria among professionals showed higher level of preferences for four criteria(On Time, Within Budget, Users Are Happy and Meets/ Exceeds Expected Benefits) , medium preference for the next five(As Originally Planned, Profitable, Innovative/ Something New, No Adverse Effects on Society and Surroundings, and Use Of New/ Improved Technology) and low preferences for two success criteria (Sticked To Original Plan Throughout Timeframe and No Adverse Comments from Stakeholders). Association between perceived level of difficulty to the preference level shows significant correlation for seven criteria. In other words, results for seven criteria supports the alternate hypothesis for H1A whereas for the remaining four criteria null hypothesis on lack of impact is observed to hold true. Thus, the paper fails to fully establish the relation between perceived level of difficulty to the level of preference for all success criteria used in project evaluation.References
- Atkinson, R. (1999). Project management: cost time and quality two best guesses and a phenomenon, it’s time to accept other success criteria. International Journal of Project Management, 17(6), 337–342. https://doi.org/10.1016/S0263-7863(98)00069-6
- Baccarini, D. (1999). The Logical Framework Method for Defining Project Success. Project Management Journal, Volume 30(Issue 4), 25–32. https://doi.org/10.1086/250095
- Baker, B. N., Fischer, D., & Murphy, D. C. (1974). Multiple Determinants of Project Success and Failure.
- Choi, J., Peters, M., & Mueller, R. O. (2010). Correlational analysis of ordinal data: From Pearson’s r to Bayesian polychoric correlation. Asia Pacific Education Review, 11(4), 459–466. https://doi.org/10.1007/s12564-010-9096-y
- Cooke-Davies, T. (2002). The “real” success factors on projects. International Journal of Project Management, 20(3), 185–190. https://doi.org/10.1016/S0263-7863(01)00067-9
- de Wit, A. (1988). Measurement of project success. International Journal of Project Management, 6(3), 164–170. https://doi.org/10.1016/0263-7863(88)90043-9
- Dvir, D., & Shenhar, A. (2007). Book Summary - The Diamond Approach to Succesful Growth and Innovation. Reinventing Project Management, 5. https://doi.org/10.1111/j.1540-5885.2008.00327_2.x
- Göktaş, A., & İşçi, Ö. (2011). A comparison of the most commonly used measures of association for doubly ordered square contingency tables via simulation. Metodoloski Zvezki, 8(1), 17–37. https://doi.org/10.5897/SRE11.1283
- Gonzalez, R., & Nelson, T. O. (1996). Measuring ordinal association in situations that contain tied scores. Psychological Bulletin, 119(1), 159–165. https://doi.org/10.1037/0033-2909.119.1.159
- Goodman, L. A., & Kruskal, W. H. (1954). Measures of Association for Cross Classifications*. Journal of the American Statistical Association, 49(268), 732–764. https://doi.org/10.1080/01621459.1954.10501231
- Hussein, B. A. (2013). Factors influencing project success criteria. Proceedings of the 2013 IEEE 7th International Conference on Intelligent Data Acquisition and Advanced Computing Systems, IDAACS 2013, 2(September 2013), 566–571. https://doi.org/10.1109/IDAACS.2013.6662988
- Hussein, B., Ramazani, S., & Kazemi, S. H. (2011). Preliminary investigation of project success criteria in Norway. Proceedings of the 6th IEEE International Conference on Intelligent Data Acquisition and Advanced Computing Systems: Technology and Applications, IDAACS’2011, 2(March 2015), 915–918. https://doi.org/10.1109/IDAACS.2011.6072906
- Ika, L. A. (2009). Project Success as a topic in Project Management Journals. Project Management Journal, 6–19. https://doi.org/10.1002/pmj
- Jefferies, M., John, G., Thayaparan, B., Jefferies, M., Brewer, G. J., & Gajendran, T. (2014). Using a case study approach to identify critical success factors for alliance contracting. Engineering Construction & Architectural Management (09699988), 21(5), 465–480. https://doi.org/10.1108/ECAM-01-2012-0007
- Jöreskog, K. G. (1994). Structural equation modeling with ordinal variables, (January 1994), 297–310. https://doi.org/10.1214/lnms/1215463803
- Jöreskog, K. G., & Moustaki, I. (2001). Factor analysis of ordinal variables: A comparison of three approaches. Multivariate Behavioral Research, 36(3), 347–387. https://doi.org/10.1207/S15327906347-387
- Joslin, R., & Müller, R. (2014). The impact of project methodologies on project success in different contexts. PMI Research and Education Conference, July 28-29, 2014, (October), 1–29. https://doi.org/10.1108/IJMPB-03-2015-0025
- Joslin, R., & Müller, R. (2015). Relationships between a project management methodology and project success in different project governance contexts. International Journal of Project Management, 33(6), 1377–1392. https://doi.org/10.1016/j.ijproman.2015.03.005
- Jugdev, K., & Thomas, J. (2001). Rethinking Project Management: Old Truths and New Insights, 7(1), International Project Management Journal.
- Kendall, M. G. (1938). A New Measure of Rank Correlation. Biometrika, 30(1), 81–93. Retrieved from http://www.jstor.org/stable/2332226
- Kothandath, S. (2018). Project Success Criteria Preferences. IUJ Journal of Management, 6(2), 73–77.
- Laroche, L., Ph, D., & Eng, P. (1998). Managing Cross-Cultural Differences in International Projects. Engineering Dimensions.
- Lloyd-walker, B. M., Mills, A. J., & Walker, D. H. T. (2014). Enabling construction innovation: The role of a no-blame culture as a collaboration behavioural driver in project alliances. Construction Management and Economics, 32(3), 229–245. https://doi.org/10.1080/01446193.2014.892629
- Müller, R., & Jugdev, K. (2012). Critical success factors in projects. International Journal of Managing Projects in Business, 5(4), 757–775. https://doi.org/10.1108/17538371211269040
- Munns, A. K., & Bjeirmi, B. F. (1996). The role of project management in achieving project success. International Journal of Project Management, 14(2), 81–87. https://doi.org/http://dx.doi.org/10.1016/0263-7863(95)00057-7
- Olsson, U. (1979). Maximum likelihood estimation of the polychoric correlation coefficient. Psychometrika, 44(4), 443–460. https://doi.org/10.1007/BF02296207
- Pinto, J. K., & Slevin, D. P. (1988). Project success: Definition and Measurement Techniques. Project Management Journal, 19(3), 67–73.
- Shenhar, A. J., Dvir, D., Levy, O., & Maltz, A. C. (2001). Project success: A multidimensional strategic concept. Long Range Planning, 34(6), 699–725. https://doi.org/10.1016/S0024-6301(01)00097-8
- Shenhar, A. J., & Wideman, R. M. (1996). Improving PM: Linking Success Criteria to Project Type. In Creating Canadian Advantage through Project Management (Vol. 25). https://doi.org/10.1007/BF00043865
- Spearman, C. (1904). The Proof and Measurement of Association between Two Things: The American Journal of Psychology. The American Journal of Psychology, 15(1), 72–101. https://doi.org/10.1037/h0065390
- Taylor, J. M. G. (1987). Kendall’s and Spearman’s Correlation Coefficients in the Presence of a Blocking Variable. Biometrics, 43(2), 409. https://doi.org/10.2307/2531822
- Villalba-Romero, F., & Liyanage, C. (2016). Evaluating Success in PPP Road Projects in Europe: A Comparison of Performance Measurement Approaches. Transportation Research Procedia, 14(January), 372–381. https://doi.org/10.1016/j.trpro.2016.05.089
- Wateridge, J. (1998). How can IS/IT projects be measured for success? International Journal of Project Management, 16(1), 59–63. https://doi.org/10.1016/S0263-7863(97)00022-7
- Yang-Wallentin, F., Jöreskog, K. G., & Luo, H. (2010). Confirmatory factor analysis of ordinal variables with misspecified models. Structural Equation Modeling, 17(3), 392–423. https://doi.org/10.1080/10705511.2010.489003