Subscribe now to get notified about IU Jharkhand journal updates!
Impact of global turmoil on equity mutual funds of India
Abstract :
The notion that buy low and sell high in stock markets is sometime also used to describe the equity mutual funds. The portfolio of the scheme or a fund perform according to the scrips that it has. The stocks perform as a result of their fundamentals in longer term. But outer shocks in forms of recessions, pandemic or wars create a misbalance in the fundamentals and the performance. This research has studied whether there is any impact of international shocks on multi cap category of the mutual fund starting from the year 2002 to 2020. This research has used ARCH and GARCH model to understand the volatility in returns of Equity schemes during those periods and whether they are being influenced by their own shocks. It was found that there is a significance impact of the outer shocks on the Multi cap portfolios of mutual funds. It has been found that the financial goals can only be achieved by consistently following and sticking to the asset allocation and judicious approach towards timing the assets may do wonders to the portfolio.
Keywords :
mutual funds, multi-cap schemes, recession.1. Introduction
The development of technology has forced the world to change rapidly in terms of almost all the aspects of life. COVID -19 pandemic proved that humans can adjust to newer ways to doing things more quickly than expected. Mutual Funds have also seen the rapid changes in the past years. From third party cheque to first party and from individual definitions of various capitalization to regulator based understanding. The basic idea to invest in mutual funds remains the same, which is creating assets over a longer period of time and achieving longer term and shorter term goals. The behavior of stock market also impacts the equity schemes of the mutual fund. Indian stocks are now being officially classified into three parts viz. Large cap, Mid-Cap and Small Cap. Large Cap are the top 100 companies in term of market capitalization, Mid-Caps are next 150 companies (i.e. from 101 to 250) and small caps are 251st company onwards. Accordingly, equity mutual fund schemes have been divided into many categories like multi-cap schemes which invest in all the capitalizations, large cap schemes investing in only top 100 stocks, mid cap schemes invest in mid-cap stocks and so on. This categorization has made the comparison and the understanding of the schemes and their performance easy.
The global shocks like subprime crisis, European Debt Crisis and the Chinese Slowdown have badly impacted the economy. Mutual funds also bearded the brunt of this turmoil and returns of the schemes in equity category became negative. This has forced the investors to reassess their investment strategy and the portfolios in which they are exposed.
Overview of Mutual Fund Industry
Unit Trust of India (UTI) was established in the year 1963by Government of India and RBI. It was done with an idea to enhance savings and investments. It also wanted to increase the participation of retail investors in the income, profits and gains accruing to the corporates from various business activities.
First phase (1964 to 1987)
Unit Scheme 1964 also called US-64 was the first scheme launched by Unit Trust of India. UTI was disconnected from the RBI in 1978 and the Industrial Development Bank of India or IDBI took over the control of regulations and administrations. Unit Trust of India had 6,700 crores of Assets Under Management by 1988.
Second Phase (1987 to 1993)
State Bank of India launched first non UTI Mutual Fund in June of 1987. Canara Bank followed the same and established a Mutual Fund in December 1987. Also Punjab National Bank launched its Mutual Fund in August 1989, Indian Bank in November 1989, Bank of India Mutual Fund in June 1990, Bank of Baroda in October1992. Life Insurance Corporation launched its mutual fund in June of the year 1989 and General Insurance Corporation in December 1990. By 1993, the Mutual Fund industry had assets under management risen significantly and reached Rs.47,004 crores.
Third Phase (1993 to 2003)
Initially SEBI had been established as the regulator of the Capital Market only and in 1992 mutual fund also came under it. First set of SEBI Mutual Fund Regulations were being introduced in the year 1993 for all mutual funds leaving UTI. Kothari Pioneer which is now merged with Franklin Templeton Mutual Fund was the first private sector MF was established in 1993 paving way to private players in the mutual fund industry. Securities and Exchange Board of India revised its MF Regulations and introduced more comprehensive regulations namely SEBI (Mutual Fund) Regulations, 1996.
Many mergers and acquisitions can be witnessed during this phase. UTI had Assets Under Management of ₹44,541 crores and that of Industry was ₹1,21,805 crores with total 33 AMCs by the end of 2003.
Fourth Phase (February 2003 to April 2014)
Beginning of the fourth phase is a very important event in the mutual fund history as it embarks the era of bringing all the mutual funds under one platform. SEBI was given the control and regulations of UTI Mutual Fund. United trust of India was divided into two entities in Feb-03, namely UTI Mutual Fund and the Specified Undertaking of the Unit Trust of India(SUUTI). From Feb-03 the assets of the SUUTI were excluded from the total assets of the mutual fund industry as a whole. UTI act came under the SEBI purview like any other MF. After the global financial crisis of 2009, capital markets all over the world did not performed well resulting in losses to retail and small investors and shattered their faith in MF Industry too.
Fifth Phase (May 2014 to present)
From May 2014, the MF Industry grew gradually in terms of assets and number of folios too. Its AUM crossed 10 Lakh Crore for the first time on 31st May 2014 and reached ₹15 lakh crore in Jul-16.
In 2020, the AUM crossed 29 lakh crore with 45 fund houses.
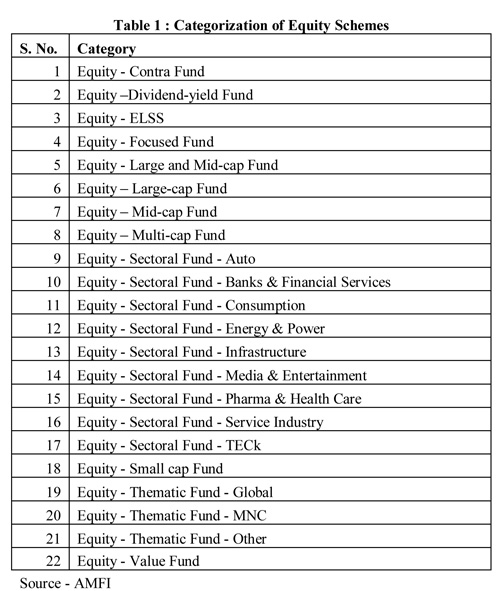
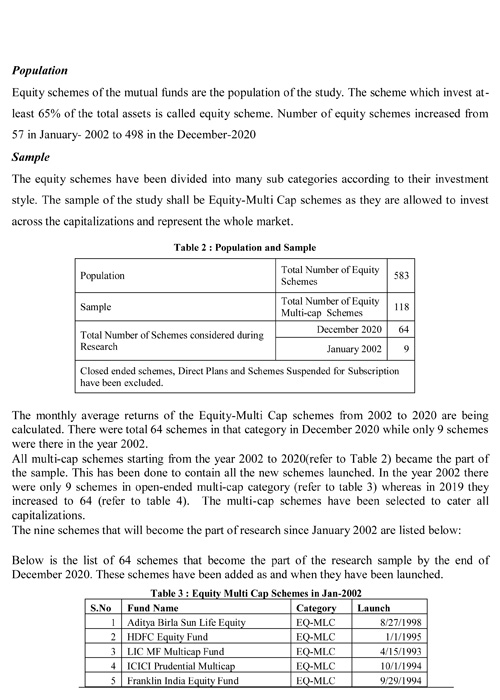
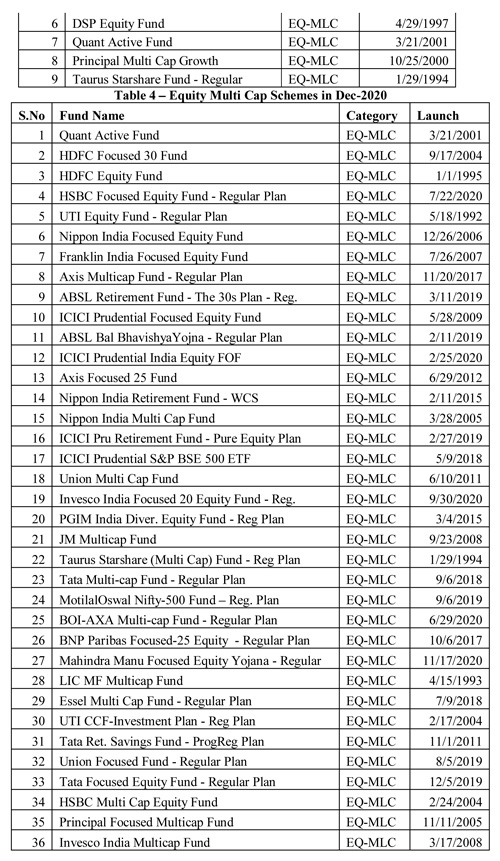
Recently the equity schemes have been categorized (refer to table 1) according to their investment pattern.
Global Turmoil
The events like subprime crisis of USA, European Debt Crisis, Chinese slow down etc. also impacts the capital market. The fundamentally strong Indian stock market came down heavily during the Subprime Crisis of USA. The Subprime Crisis originated within the US due to the subprime lending by banks for housing. The defaults in those loans led to the shutting down of big companies like Lehman Brothers and inflicted severe losses to the stakeholders. Indian stock market came down significantly which retrospectively impacted equity schemes of mutual funds. Thus a more comprehensive and significant role of outer shocks like these can be felt in the capital market instruments.
The retail investors tend to book losses when market start coming down. There are numerous researches pertaining to the outer shocks like recessions, wars or other economic crisis. Theses researches are discussed in review of literature so as to have more understanding of the research.
Review of Literature
Before embarking on the research, it becomes necessary to have a look on some of the concerned literature relevant to it.
The review of the concerned literature is given below:
Blanchard (1993) found that all the recessions behave differently. Recession occurring due to decreases in output other than lesser consumption are short lived and recover sharply. If this decrease in output come from lower consumption, then it last longs and recover weakly. For example, the recession of early 90s in USA was caused due to decrease in consumption which was conditional and hence led to slow recovery.
Barua et al (1994) reviewed the researches done on Indian capital market over a 15-year period from 1977 to 1992 and found that most of the areas were untouched. The researches lack referencing. On mutual funds, they found that most researches were on UTI Master share fund and it performance.
Kaminsky et al (2000) examined the role of mutual funds in spreading crises like recessions and defaults in currencies. The focus was on whether funds flows are linked to emerging economies and their degree of fragility, the opening of their capital-market and liquidity status, and the level of political risk. They also studied in particular detail the behavior of U.S.-based Latin-American mutual funds like impact of redemptions on funds management liquid position. They concluded that apart from economic fragility, liquidity also leads to redemptions. When faced with redemptions, mutual fund managers withdraw their money from capital market impacting their liquidities.
Bullard, J. (2002) used charts to describe the impact of recession on the US economy. During the start of 1994, the level and growth of M1 have been depressed by retail sweep programs that reclassified the transactions deposits like demand deposits and other checkable deposits as savings deposits overnight, thereby reducing bank’s required reserves.
Prandran and Seilan (2008), studied the relationship between trade, foreign direct investment and economic growth in India over the period 1970 to 2007. They applied Granger causality test and the result showed that there is a causal relationship effect between the variables. The causal relationship ranges from FDIs to growth rate and there is no causal relationship between growth rates and FDI. Most empirical studies conducted in the past used a multiple regression model to study the impact of Foreign Portfolios and Foreign Direct Investment flows.
Prasad and Reddy (2009) in their research “Global Financial Crisis and Its Impact on India” concluded that savings habits among people, strong fundamentals and conservative and regulatory regime saved Indian economy from going out of gear. Although significant parts of the economy slowed down and there was a wide variance of opinion about how long it will continue. Growth expectation was moderate for India. They concluded that Self-reliance in all the sectors is important and suggested protectionism in economic policies for some sectors so as to decouple from the outer shocks.
Giannone et al (2011) in their research titled Market freedom and the global recession” stated that that the set of policies that favor liberalization in credit markets with reference to their regulatory quality are negatively correlated with country’s resilience to the recession as measured by output growth in 2008 and 2009. The negative correlation exists due to the inclusion of a wide range of controls like income per capita, variables capturing the depth of the financial market. It also added banking competition, liquidity and financial and macroeconomic imbalances and several robustness tests. Additionally, credit market regulation was found to be one of the five most significant variable with a negative sign explanatory variablewhile considering a wide range of potential predictors jointly, for the decline in output growth in 2008 and 2009.
Vennila&Nandhagopal (2012) in their research “Study on Performance Evaluation of Mutual Fund Schemes in India during Pre-recession, Recession and Post-Recession Period” found that there was a mass-scale migration by funds towards safety and surge in FMCG stocks. They also found that the performance of the funds was different from each other, though a few firm had common attributes which can be seen from the clusters that they make, a few funds didn’t fall into any cluster at all. They concluded that much of the Mutual Fund industry recovered over the 1-year period since the collapse of Lehman Brothers and was evident in the returns generated by many funds and these gains are nothing to sneeze at.
Babbar& Sehgal (2018) researched open-ended Indian equity (growth) schemes during the period April 2007 to March 2013. They used daily dividend adjusted net asset values,the risk-adjusted performance was estimated by employing conditional version of Carhart (1997) four factor model in a time series regression framework. Varied range of fund attributes like the size of fund, growth in size of fund, expense ratio, portfolio turnover, NAV and age of fund were examined in predictive model in a panel data regression framework that may determine the future performance of the fund. The Housman specification test was conducted to decide if individual effects are random or fixed. The results of panel regression, based on fixed effects estimator, showed that the size of fund, growth in size of fund and NAV negatively affect one period ahead risk-adjusted performance in India, while the age of fund has a positive impact. Expense and portfolio turnover ratios do not play a significant role.
Sanjay et al (2019) concluded that overall the Indian MF industry has been growing in terms of AUM of all fund expect GOLD ETF and Other ETF and Fund of Fund. Folios are increasing every year a negative correlation between debt fund and equity fund in terms of growth. The retail and HNIs folios growing continuously, but the growth of HNI is more than that of retail. Equity oriented schemes have grown more than index funds. Indian MF industry growth rate is higher than Europe and Asian Pacific regions, but it is equal with America and has higher growth rate since 2017.
Sharma (2020) found after analyzing five debt funds that three funds have performed well and two funds had not performed well during the study period. The sharp fall in nifty during the year 2019 has impacted the performance of all the selected funds. He concluded that all the funds have performed well in the high volatile market movement expect Axis Corporate Debt fund & HSBC Debt Fund. Therefore, investors need to consider statistical parameters like alpha, beta, standard deviation while investing in mutual funds apart from considering NAV and TOTAL RETURN to ensure consistent performance of mutual funds.
Research Gap
After reviewing the literature, it can be concluded that there exist a certain relationship and an impact of the outer shocks or events like recessions, wars, banking crisis, etc. on the stock markets and hence the instruments dealing in it. There are many literatures on the impact of outer shocks on Indian Stock market but none can be found analyzing the impact of the outer shocks on the Equity – Multi Cap Schemes of Indian Mutual Funds.
Statement of the Problem
The statement of the problem is “Impact of Global turmoil on Indian Equity Mutual Funds of India”
Significance of the Study
The study is important because mutual fund industry is now a formidable investment avenue and many people take exposure of the schemes to achieve their goals. The greed to make more money and the fear to lose the capital keep investors and the advisors on their toes and sometime asset allocation is being altered or completely ignored. This results in losses and the investor has to go through hard times experiencing the loss of his hard earned money. The significance of the study is that it will help the concerned people to take informed decisions in terms of risk and returns pertaining to mutual fund schemes.
Objectives of the Research
The research objectives are listed below:
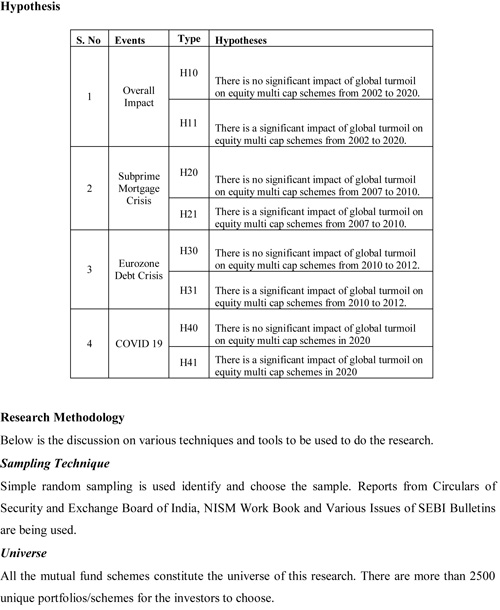
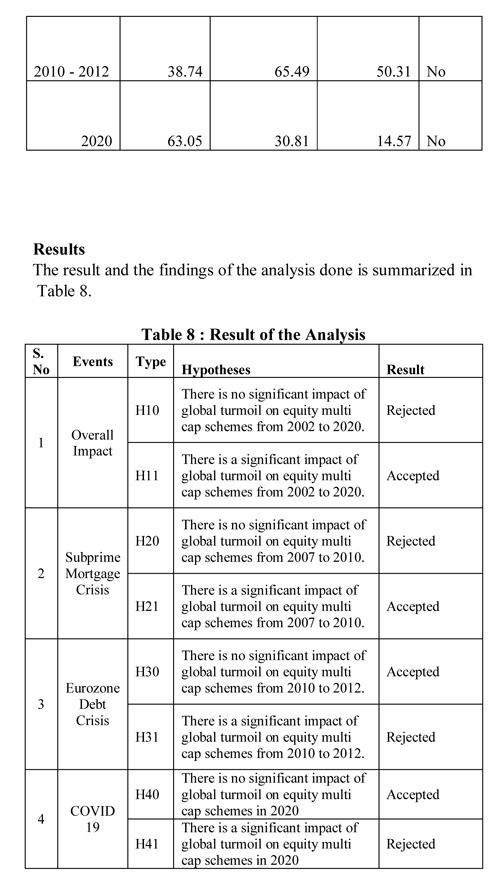
1) To find the impact of global turmoil on equity multi cap schemes from 2002 to 2020 which means complete impact.
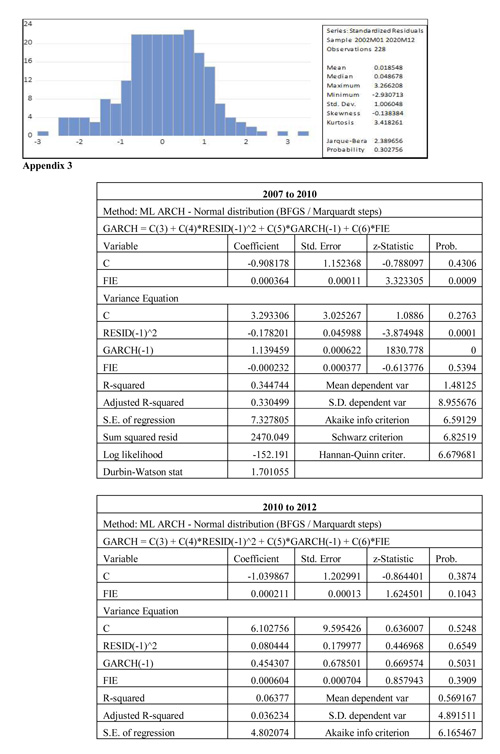
2) To find the impact of the Global turmoil on equity multicap schemes from 2007 to 2010 during United States subprime mortgage crisis.
3) To find the impact of the Global turmoil on equity multi cap schemes from 2010 to 2012 during Eurozone Debt Crisis.
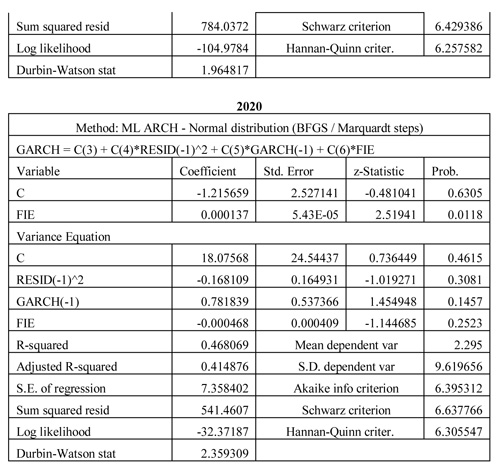
4) To find the impact of global turmoil on equity multi cap schemes during COVID-19 which is 2020.
Hypothesis
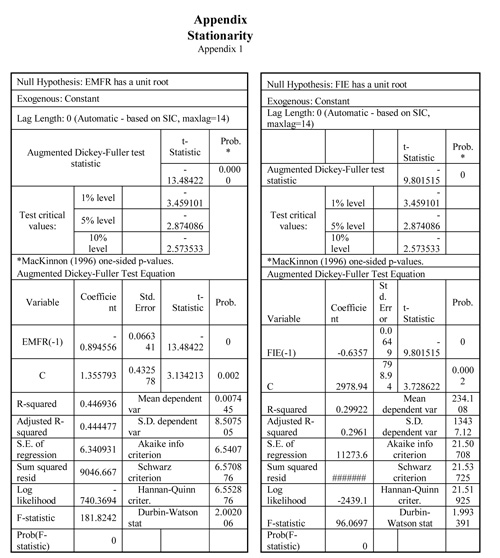
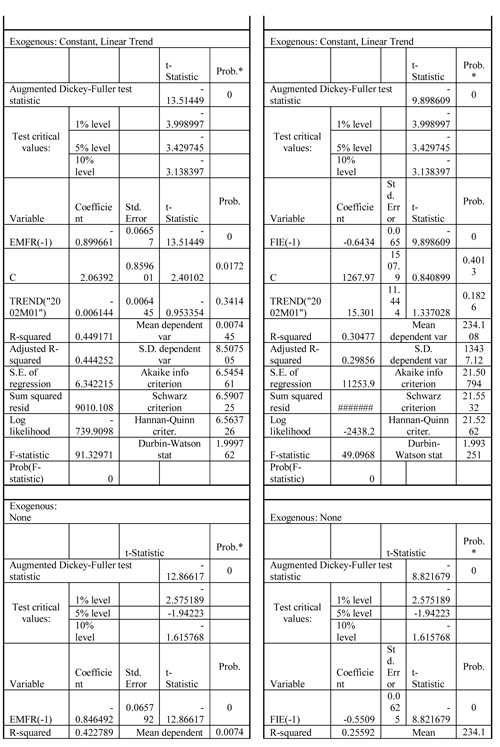
Stationarity
Augmented Dicky Fuller Test (ADF test) is used to analyze the stationarity of the data which becomes the basic requirement for the application of ARCH and GARCH model.
GARCH (1,1) Model
It is used to analyze the average monthly returns of the equity –multi cap schemes of mutual funds. The generalized autoregressive conditional Heteroskedasticity (GARCH) process is an approach to estimate the volatility of financial markets in panel data. This model will be used to estimate the return volatility of returns for equity multi cap schemes.
The ARCH process initially was introduced by Engle in 1982 who explicitly recognizes the difference between the unconditional and the conditional variance allowing the latter to change over time as a function of past errors.
Generalized Autoregressive Conditional Heteroskedasticity, or GARCH, is an extension of the ARCH model that incorporates a moving average component together with the autoregressive component.
Specifically, the model includes lag variance terms for example the observations if modelling the white noise residual errors of another process. It together with lag residual errors from a mean process.
The moving average component introduction allows the model to both model the conditional change in variance over time as well as changes in the time-dependent variance.
The model introduces a new parameter “p” that describes the number of lag variance terms:
p: The number of lag variances to include in the GARCH model.
q: The number of lag residual errors to include in the GARCH model.
A generally accepted notation for a GARCH model is to specify the GARCH () function with the p and q parameters GARCH (p, q); for example, GARCH (1, 1) would be a first order GARCH model.
A GARCH model subsumes ARCH models, where a GARCH (0, q) is equivalent to an ARCH(q) model.
The study shall use GARCH (1,1) model to ascertain the volatility of Equity Mutual Fund Returns vis a vis external factors too like FPIs Inflows in Equity.
Steps to be taken to Analyse the Data
First the mean and the variance equation is defined and then the result
Mean Equation
X = C1 +C2*Y +e ……………………. equation 1.1
Dependent Variable is X
Independent Variable is Y
C is Constant
Monthly data the time period is being taken.
Residual shall be plotted for dependent variable.
If high volatility has to be followed by prolonged period of high volatility and low volatility has to be followed by prolonged period of low volatility, then residual is said to be conditionally heteroskedastic and can be represented by ARCH and GARCH model.
Variance Equation
Ht =C3 +C4*Ht-1 +C5*e2t-1 +C6*Y ……………… Equation – 1.2
Here Ht is the residual (error term) derived from the equation 1.1. Also called current period’s volatility of X.
Ht-1 is the previous day’s residual variance or volatility of X. It is the GARCH term.
e2t-1 is the previous period’s squared residual derived from equation 1.1. It is also called previous period’s dependent variable information about volatility. It is called ARCH term.
Equation 1.2 is the GARCH (1,1) model as it has first order ARCH e2t-1) and GARCH (Ht-1) term.
Evaluations of the Models Under Three Distributions
All the variables are stationary.
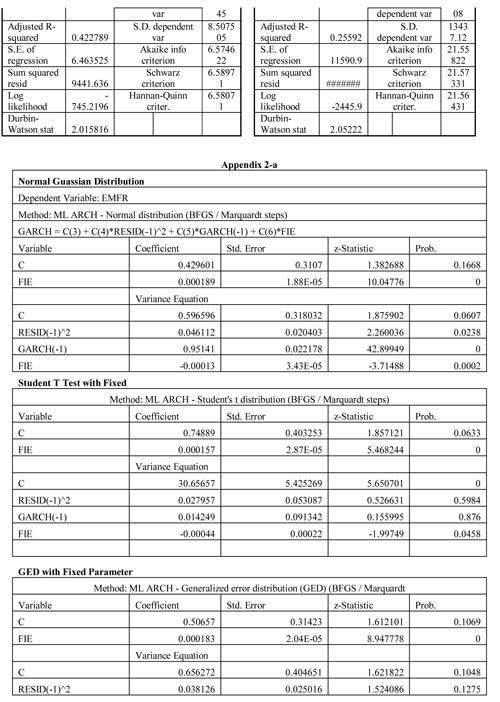
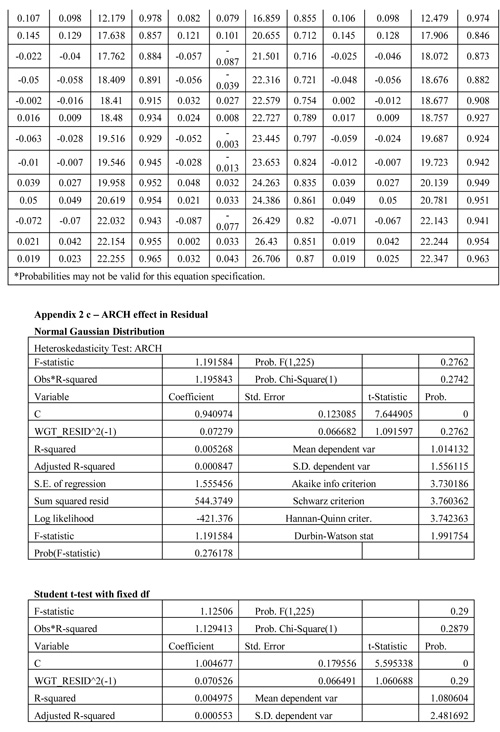
Discussion of Result of GARCH (1,1) Model: Variance Equation
Three types of Error Distribution have been used in the study-
1) Normal Gaussian Distribution.
2) Student’s t test with Fixed Degree of Freedom.
3) Generalized Error Distribution with Fixed Parameters.
Model Estimation
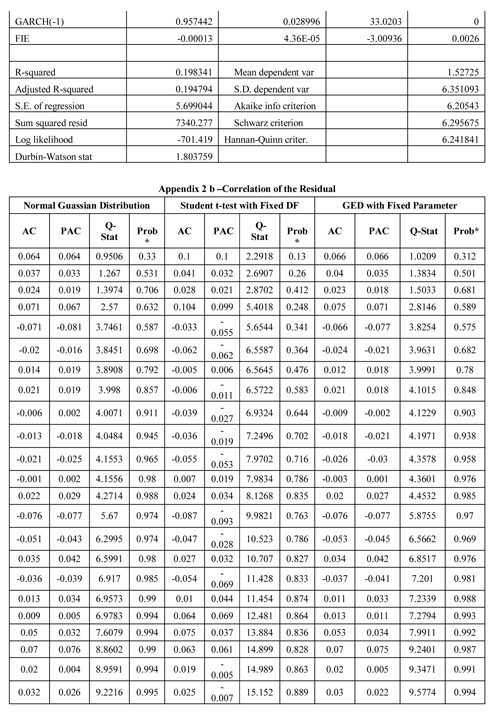
All the above models shall be estimated and accepted if the three conditions are met-
1) There should be no serial correlation in the residuals.
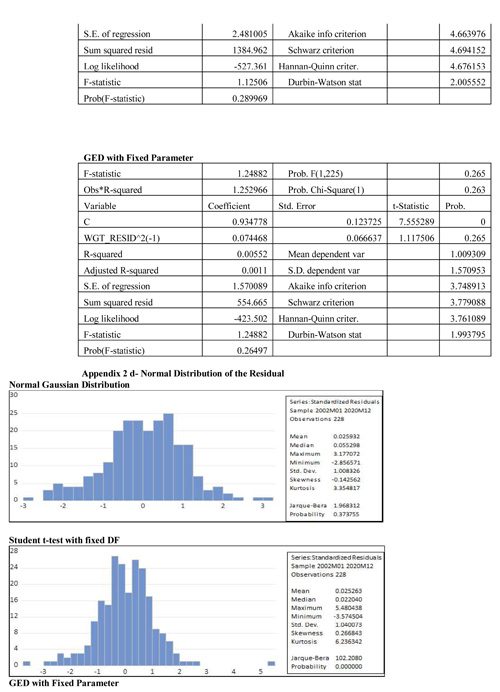
2) The residual should be normally distributed.
3) Residuals must not be having ARCH effect.
Analysis and Results
Before jumping to data analysis, unit root test has to be done so as to understand whether the variables can be used for GARCH model or not.
Stationarity
Augmented Dickey Fuller Test
Null Hypothesis – Times Series has a unit root.
Alternate Hypothesis - Time Series has no unit root.
Stationarity Outcome from the E – Views for Augmented Dickey-Fuller Test Equation
Following is the summary outcome of the Augmented Dickey-Fuller test (refer to table 5).
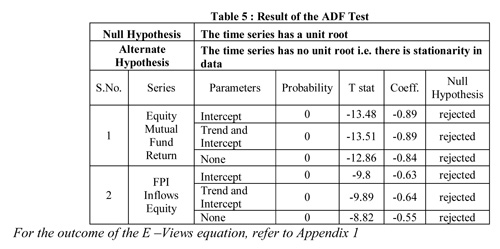
Result
It has been found that all the 6-time series are stationary without a unit root as null hypothesis is being rejected and further analysis can be done (refer to table 6).
GARCH (1,1) Analysis
The time series is found to be stationary and hence further analysis of the data can be done.
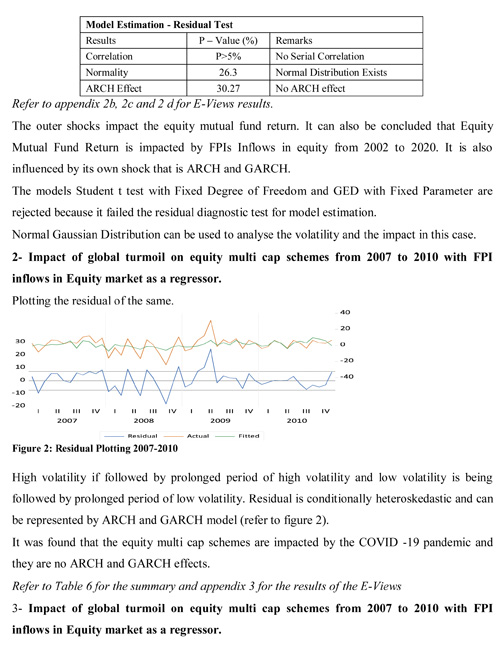
1-Impact of Global Turmoil on Equity Mutual Fund Return from 2002 to 2020 with FPI inflows in Equity market as a regressor.
First the mean and the variance equation is defined and then the result shall be arrived.
Mean Equation
EMFR = C1 +C2*FIE +e ……………………. equation 1.1
Dependent Variable is EMFR (Equity Mutual Fund Returns).
Independent Variable is FIE (FPI Inflows in Equity Market).
C is Constant and Monthly data from 2002 to 2020 is being taken.
Residual is being plotted for equity Mutual Fund return
<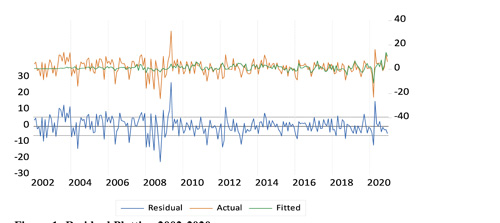
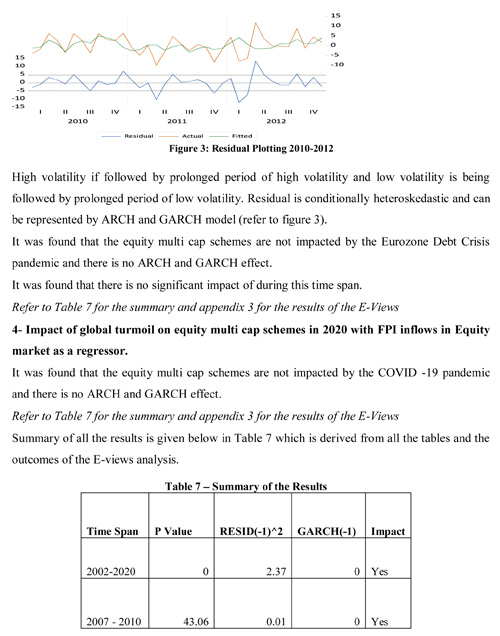
High volatility if followed by prolonged period of high volatility and low volatility is being followed by prolonged period of low volatility (refer to figure 1).
Residual is conditionally heteroskedastic and can be represented by ARCH and GARCH model.
Variance Equation
Ht = C3 +C4*Ht-1 +C5*e2t-1 +C6*FIE …… Equation 1.2
Here Ht is the residual (error term) derived from the equation 1.1. Also called current day’s volatility of equity Mutual Fund return.
Ht-1 is the previous day’s residual variance or volatility of the equity Mutual Fund return (EMFR). It is the GARCH term.
e2t-1 is the previous period’s squared residual derived from equation 1.1. It is also called previous period’s equity Mutual Fund return information about volatility. It is called ARCH term.
Equation 1.2 is the GARCH (1,1) model as it has first order ARCH e2t-1) and GARCH (Ht-1) term.
Evaluations of the Models Under Three Distributions
All the variables are stationary and thus discussion of Result of GARCH (1,1) Model: Variance Equation
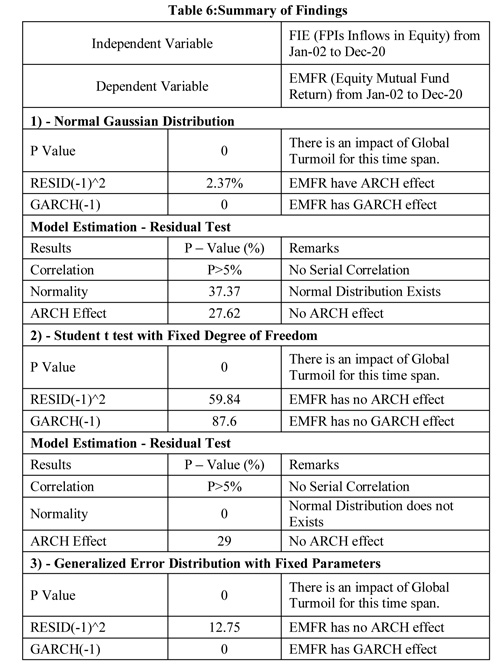
All the Error Distribution used in this study are being discussed below-
1) Normal Gaussian Distribution.
Under this distribution, ARCH is significant which means that previous period’s Equity Mutual Fund Return information (ARCH) can influence today’s Equity Mutual Fund Return Volatility. It is e2t-1 in equation 1.2. GARCH is also significant implying that previous period’s Equity Mutual Fund Return volatility can influence current equity Mutual Fund Volatility. It is Ht-1 in equation 1.2 called GARCH. FPIs inflow Equity is also significant, which implies that volatility in the FPI or FPI inflows can impact the returns and volatility in equity Mutual Fund returns.
2) Student’s t test with fixed difference.
Under this distribution, ARCH is not significant which means that previous period’s Equity Mutual Fund Return information (ARCH) can’t influence today’s Equity Mutual Fund Return Volatility. It is e2t-1 in equation 1.2.GARCH is also not significant implying that previous period’s Equity Mutual Fund Return volatility can’t influence current equity Mutual Fund Volatility. It is Ht-1 in equation 1.2 called GARCH. FPIs inflow Equity is significant, which implies that volatility in the FPI or FPI inflows can impact the returns and volatility in equity Mutual Fund returns.
3) Generalized Error Distribution Assumption with Fixed Parameters.
Under this distribution, ARCH is not significant which means that previous period’s Equity Mutual Fund Return information (ARCH) can’t influence today’s Equity Mutual Fund Return Volatility. It is e2t-1 in equation 1.2. GARCH is significant implying that previous period’s Equity Mutual Fund Return volatility can influence current equity Mutual Fund Volatility. It is Ht-1 in equation 1.2 called GARCH.FPIs inflow Equity is also significant, which implies that volatility in the FPI or FPI inflows can impact the returns and volatility in equity Mutual Fund returns.
Model Estimation
Suggestions
The research suggests that there is an impact of global turmoil on equity mutual funds and hence it become important to revisit the investment strategy that an individual follow.
Given below are some suggestions to the concerned players:
1) The investor should stick to their asset allocation at every point of time.
2) There must be no propensity to invest just because the market is continuously going up or down.
3) Long-term and short term financial goals have to be taken into consideration while deciding the asset allocation.
4) No matter how much risk an investor is ready take, there should be some funds available to average out during down falls.
5) Emergency or contingency funds must not be exposed to equity schemes because of the volatile nature in shorter runs.
6) During Global turmoil or outer shocks, investors must try to keep on adding some funds on the down side. Rupee Cost Averaging popularly known as Systematic Investment Plan or SIP in Mutual Funds must be used to do the same.
7) Old age investors with lower risk profile should abstain from exposing themselves to equity schemes.
8) The investor must also assess the ability and the intention of the advisor by getting clarity on all the schemes offered by him.
9) Past returns of the schemes and that of the fund manager may not always be same as fund manager may change. Past returns may or may not be generated by the equity schemes.
10) Investment must be done on the basis of the portfolio of the schemes and not on their past returns. Good advisors or planners can be consulted in case of a layman.
Policy Implications of the Study
There can be various implications on the policy that is there to manage and regulate Mutual Funds in India. They are being discussed in detail below-
1) Tax Implications
Currently, an individual investor has to pay 10 percent long term capital gain tax over and above one lakh rupees after one year. This means if someone has invested Rs.5 lakhs in an equity scheme and has redeemed Rs.7.5 Lakhs after one year, the long term capital gain generated is Rs. 2.5 lakhs and the taxable capital gain shall be Rs.1.5 Lakhs.
The tax on long term capital gain has to be abolished and the tenure must be increased to either 3 years or 5 years. This shall lure investor to stay invested for a longer period of time and hence saved from the volatilities in short term.
Also, the STCG or short term capital gain tax which is currently 15% if redeemed within a year must be increased to 20 % so that the revenue loss due to LTCG wave off by the government can be taken care of.
2) Commission to Agents
In India Mutual Fund is mostly sold and marketed through distributors like Banks, Mutual Fund Distributors and National Distributors. They do it to earn a commission fee from the Asset Management Company or AMC of the Mutual Fund. These commissions are higher for first year and decrease after that.
This should be reversed. First year commission should be lesser and increased gradually as the asset become older. This shall help investor immensely. The frequent churning of the investments shall be contained and the investors will be told to hold on for a longer period of time.
3) Investor Education Initiatives
SEBI and AMFI have mandated the Asset Management Companies to conduct Investor Awareness Programs regularly. It resulted in significant growth of the Industry but could not transform it to the level as desired.
There should be dedicated team of trainers at all the locations where there is an office and these trainers should be monitored regularly to get desired results. SEBI should come up with mandatory attendance of these programs by the investors so that they have full understanding of the risks associated with the products and how they can be used to achieve their long-term and short-term financial goals.
Conclusion and Discussion
It can be concluded that there is a significant and unprecedented impact of the global shocks on the performance of the equity schemes and thus the investors have to keep a track of what is happening globally. The outer shocks and their impacts are so adverse that they lead to panic selling among the retail investors. Even the agents become so afraid, that when the markets start falling, they could not restrain their clients to abstain from redeeming.
The wealth management clients and the advisors have to take extra precautions while exposing to equity schemes for short period. Sticking to asset allocation for a longer period of time surely give better returns. Goal oriented investing is very important to take care of short term risks.
Limitations and Scope of Future Research
The limitations of the research and the scope of further research are listed below
1) Only Multi cap category of the equity schemes were used for the research. Other categories like Large Cap, Mid Cap, Small Cap, Value Funds etc. can be used to research further.
2) The time span of the study was from 2002 to 2020. It can be expanded to much greater time period.
3) Only monthly returns are being considered. Daily or weekly data may have fetched better results.
4) Equity market was considered to conduct the research. Debt market schemes can also be used to do the same research.
5) Other statistical tools like Granger Causality can also be used to test the hypotheses.
References
- Babbar, S., & Sehgal, S. (2018). Mutual fund characteristics and investment performance in India. Management and Labour Studies, 43(1-2), 1-30.
- Barua, S. K., Raghunathan, V., & Varma, J. R. (1994). Research on the Indian capital market: a review. Vikalpa, 19(1), 15-32.
- Blanchard, O. (1993). Consumption and the Recession of 1990-1991. The American Economic Review, 83(2), 270-274.
- Bullard, J. (2002). Measuring recession severity. Monetary Trends, (sep).
- Giannone, D., Lenza, M., & Reichlin, L. (2011). Market freedom and the global recession. IMF Economic Review, 59(1), 111-135.
- Jayachandran, G., &Seilan, A. (2010). A causal relationship between trade, foreign direct investment and economic growth for India. International research journal of finance and economics, 42, 74-88.
- Kaminsky, G., Lyons, R., &Schmukler, S. (2000). Economic fragility, liquidity, and risk: the behavior of mutual funds during crises. unpublished paper, World Bank.
- Prasad, A., & Reddy, C. P. (2009). Global financial crisis and its impact on India. Journal of Social Sciences, 21(1), 1-5.
- Sanjay, A., & Bhavana Raj, K. (2019). Performance and persistence of Indian mutual fund industry. International Journal of Recent Technology and Engineering, 8(2), 5212-5216.
- Sharma, K. B. (2020). Performance Analysis of Mutual Fund: A Comparative study of the selected debt scheme of mutual fund in India.
- Vennila, A., &Nandhagopal, D. R. (2012). Study on Performance Evaluation of Mutual Fund Schemes in India During Pre-Recession, Recession and Post-Recession Period. International Journal of Management (IJM), 3(1), 126-134.
- SEBI. (n.d.). Archives. Retrieved from www.sebi.gov.in
- Association of Mutual Funds in India. (n.d.). TER DATA. Retrieved from www.amfiindia.com
- RBI. (n.d.). Annual Reports. Retrieved from www.rbi.org.in