Subscribe now to get notified about IU Jharkhand journal updates!
Implementation of Project Management Practices in Aerospace Manufactucturing Industry – Challenges in Pandemic Times
Abstract :
Boeing has been in collaboration with various suppliers all over the world who manufacture the parts and components for the aircrafts. But now the company is planning to implement vertical integration i.e., bringing the manufacturing activities in-house for some parts and cut on excess cost that their suppliers charge. Establishing a centre in India is a part of their cost cutting plan since the labour here is skilled and cheap. Not only this, it will help in losing some burden from other Boeing facilities in US by creating a similar facility in India that can run at a much lower cost. So the India centre is getting projects from the parent company but is still in the development phase. The major project objectives are to develop a Project Man-agement Tool capable of planning, execution, tracking and overall management of their In sourcing project to work with the team of Project managers who were responsible for plan-ning, execution and tracking of the entire project. This study becomes more relevant in recent times since due to the Corona virus pandemic, many countries like America, Europe, Canada, Australia etc have been hit with supply chain shocks as the flow of materials from China was disrupted. India being the biggest economy amongst the only five low cost coun-tries including Mexico, Indonesia, Brazil and Thailand and with the largest untapped potential for filling part of the supply chain vacuum that is created by exodus from China can definitely benefit from the situation.
Keywords :
Vertical integration, Project Management tool, Execution, Pandemic times1. Introduction
Boeing is the world's largest aerospace company and leading manufacturer of commercial jetliners, defense, space and security systems, and service provider of aftermarket support. As America’s biggest manufacturing exporter, the company supports airlines and U.S. and allied government customers in more than 150 countries. Boeing products and tailored ser-vices include commercial and military aircraft, satellites, weapons, electronic and defence systems, launch systems, advanced information and communication systems, and perfor-mance-based logistics and training.
Boeing has been in collaboration with various suppliers all over the world who manufacture the parts and components for the aircrafts. But now the company is planning to implement vertical integration i.e., bringing the manufacturing activities in-house for some parts and cut on excess cost that their suppliers charge. Establishing a centre in India is a part of their cost cutting plan since the labour here is skilled and cheap.
Not only this, it will help in losing some burden from other Boeing facilities in US by creat-ing a similar facility in India that can run at a much lower cost. So the India centre is getting projects from the parent company but is still in the development phase.
Methodology and Study Design
Introduction:
With Boeing India, the main role was to be a part of the strategic planning of multiple de-sign and manufacturing departments and make the existing project management practices robust to enhance the team and overall organization productivity. Below are few of the pro-jects.
a. In sourcing Project
In sourcing is a team committed to increasing Boeing's presence in the airplane parts af-termarket. In sourcing works across the enterprise, with Program Engineering, Supplier Management, Category Management, Regulatory Administration, and many others to bring alternative solutions to Boeing's Customers.
In sourcing increases Boeing's competitive edge by creating alternative, value added, spare parts options for airline customers. This is accomplished by increasing Boeing's In-tellectual Property and growing sales of new Boeing Proprietary Parts.
This project is running in 5 different locations all over the world and India is one of them. The process flow of the project is as follows:
Department 1:
The parts are shipped from US to India port and then sent to the Department 1 in MS Ramaiah College, Bangalore for the reverse engineering process. The Team there con-ducts the Metrology and Material analysis and sends the report to Design team at Boe-ing India centre.
Department 2:
The Department 2 includes the Design Team who does the 3D modelling, Stress analysis, 2D printing and sends the design to the Department 3 in South California team for Qualification.
Department 3:
The Department 3 reviews the design sent by the Department 2 and then either qualifies, holds or rejects the design.
Department 4:
When the drawing is qualified by the department 3, it is released by the company to the suppliers for the manufacturing of the part.
b. The New Facility Project
For the first time, Boeing is investing in setting up an assembling facility of its own out-side US. This facility is being planned to be located near the Bangalore International Air-port in Devanhalli. This facility is going to be an assembly unit for some parts of an air-craft and is planned to be fully functional by the end of 2 years.
This facility is a replica of a facility in Smithfield, PA,USA . The Smithfield facility responsible for assembling Avionic parts for the plane. These are the main parts that are used in the central flight management and Smithfield is the only facility in the world as-sembling them.
The main objective of setting up a facility in India is to mitigate the risk that is associat-ed with the Smithfield PA facility. The risks can be a machine breakdown, facility shut-down, weather calamity etc. If the Smithfield facility is unable to produce avionicsparts for somereas on, then there should be some other facility that must produce and provide the parts to the aircraft.
Advantages of setting up a facility in India are:
• The labour is cheap and skilled
• Cost for constructing the unit is also less
• The land is big and easily available
• Setting up a facility in India is beneficial to the Boeing US because of the Make In India initiativeastheyhavemanypotentialordersforaircraftsinbothde-fenceandcommercial segment in future.
The facility is in a very nascent stage. It has planned to have an assembly unit in the ground floor and then office and administrative floor above it.
The parent company and India centre have decided to release their first product by Janu-ary of 2020. So the Project manager who has been assigned on this project has the main task of first creating a project plan that will give a clear picture of all the activities that are required to release the first product. The Parent company is very invested in getting the facility functional as soon as possible.
As the idea of setting up an entirely new facility for an electronic product is very new for the India centre. So the project started with
• Weekly meetings with the Program Managers of Smithfield facility to understand the project plan
• Understanding the product and its specifications and the types of machines that will be required for the unit
• Understanding the cost estimation and creating our own to present the US team
• Understanding different types of qualifications and certifications required for the product
• The type of labour and training required for them
• Understanding the different types of licenses required at different points of time
• Creating our own project plan and getting an approval from the managers in US
• Developing a Business case and our own Risk Register
• SettingupmeetingsinIndiacentrewithdifferentstakeholderslik-eArchitects,System Engineers, Manufacturing Engineers etc. on a regular ba-sis
Source of data:
Primary Data source
Internal Project Plans
Presentations
Cost estimation sheet
Business case
Boeing templates and Internal Templates
Secondary Data Source
Weekly meetings with the Program managers
Internal meetings with different stakeholders
One-on-one meetings with the functional managers and Project managers
Tools for analysis:
Excel was used as an analytical tool for analyzing, displaying and generating final inferences. Below are the various formulas and tools used within excel for interpretation of the data:
Excel Macro -A macro is an action or a set of actions that you can run as many times as you want.
Various Formulae
Offset, Indirect, Count ifs, Average ifs, Index, Mod, Sum, If, Match, If error, Count
Statement of the Problem:
The organization is newly established in India and intends to bid more projects from the Parent organization. However, they didn’t have an infrastructure in place to start with design and manufacturing.
For the existing business in India, the company was struggling to measure the productivity and efficiency of the employees, team and organization as a whole. The existing project management was extremely weak and incapable to handle large upcoming projects.
Scope of the Study:
This project aims to improve and standardize the project management practices and perform the planning for the installation of the new facility.
Objectives of the Project:
Primary Objective:
• To develop a robust excel based Project Management Tool capable of planning, execution, tracking and overall management of the project.
• Todevelopanexcelbasedtoolthatwillcalculatethedepreciatedvalueoftheplantand machinery.
Secondary Objective:
• Understand the project requirement documents like Cost Estimation sheet, Pro-ject Plans, Presentations about the device to be produced, Business Case etc
• Rigorous brain storming sessions with my manager, attend various meetings with dif-ferent stakeholders and create minutes of the meetings
• Create a Risk Register for the project
• Create a project plan that will contribute in giving an idea to create the major plan
Methodology
a. In sourcing Project:
As the project in India was in fairly nascent stage, there was no proper project management in place to track the performance. Main task here was to work with the Project manager and assist him in the planning, tracking and execution of the project. This included creating a ro-bust Project Management Tool that will be capable of monitoring the overall project status and the also the statuses of departments and different parts individually.
Following is the list of Project Management tools that were created.
• MSRT(Monthly Status Reporting Tool)
• EVM(Earned Value Management)
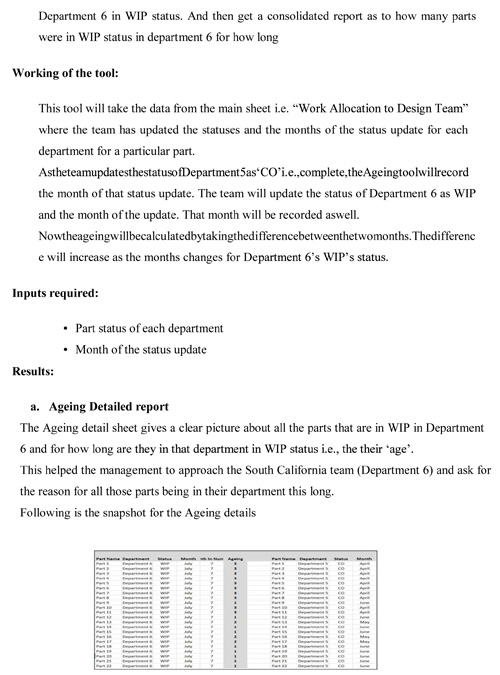
• Ageing Tool
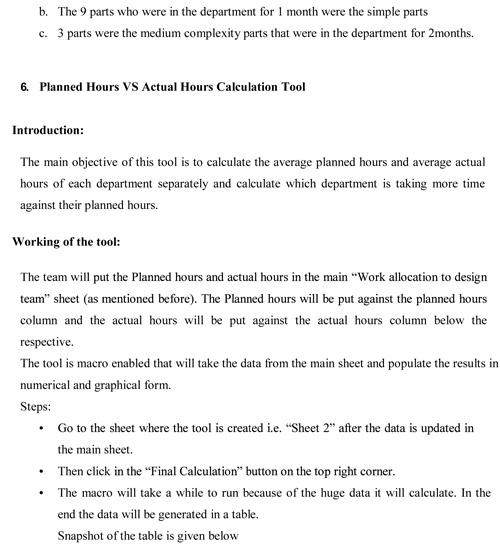
• Average Planned Hours VS Average Actual Hours
b. The New Facility Project:
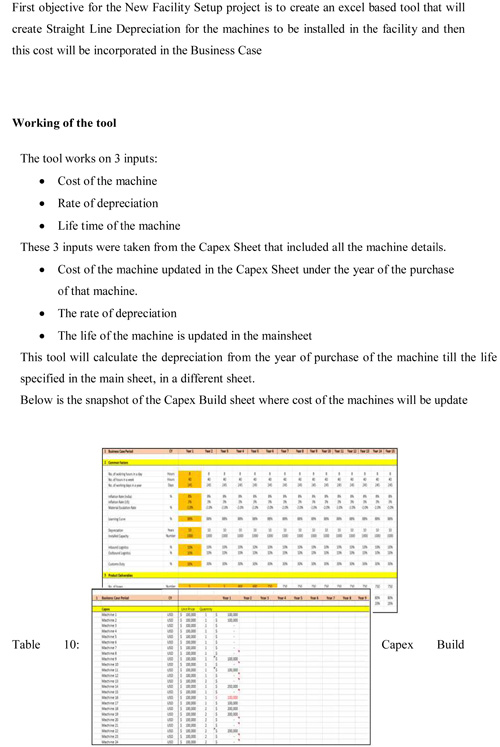
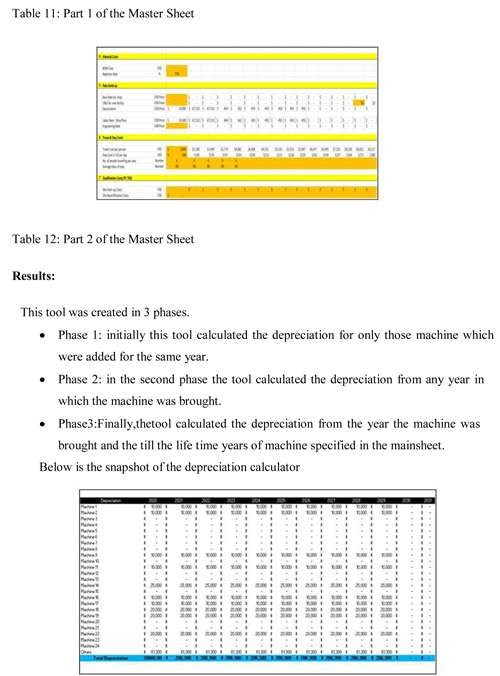
For the New Facility Setup project and a robust excel based tool was developed that will generate the depreciated value for the machines to be installed in the facility and then this cost will be incorporated in the regular Business functions. This process involved under-standing of the depreciation concept and the straight line depreciation.
Straight Line Depreciation
Straight line depreciation method charges cost evenly throughout the useful life of a fixed asset. This depreciation method is appropriate where economic benefits from an as-set are expected to be realized evenly over its useful life. Straight line method is also con-venient to use where no reliable estimate can be made regarding the pattern of economic benefits expected to be derived over an asset's useful life.
Depreciation per annum = ( Cost − Residual Value )/Useful Life
epreciation per annum = ( Cost − Residual Value ) x Rate of depreciation
Results, Analysis and Discussions
In sourcing Project
1. MSRT (Monthly Status Reporting Tool)
Introduction:
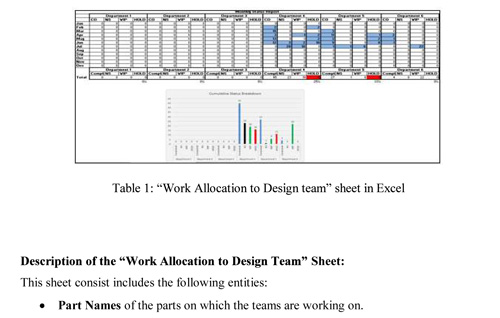
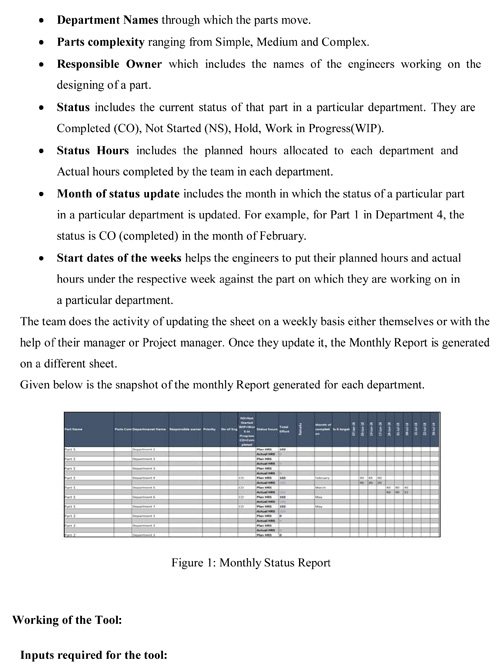
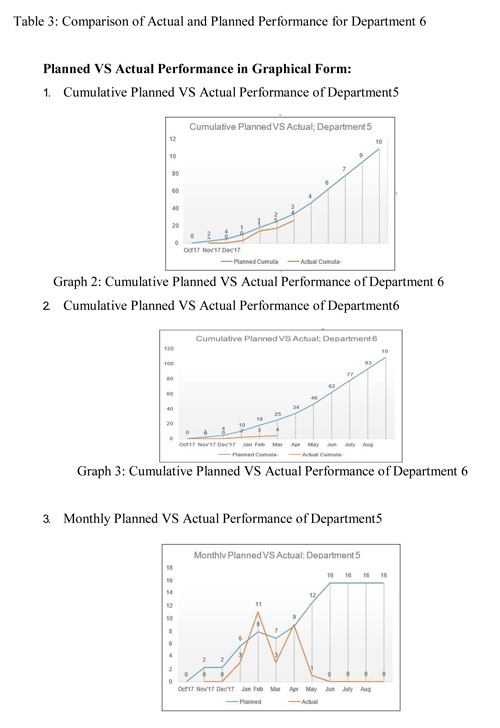
This Tool produces the monthly report of all the departments and their statuses (Completed, Not started, Hold, and WIP). This tool will take the data from a different sheet that the team uses to put the weekly hours and update the status of the parts in each department. This sheet is known as “Work Allocation to Design Team”. The Team updates this sheet on a weekly basis and through this sheet the Monthly Progress Report is generated.
Below is the snapshot of the “Work Allocation to Design Team” tab that the team uses.
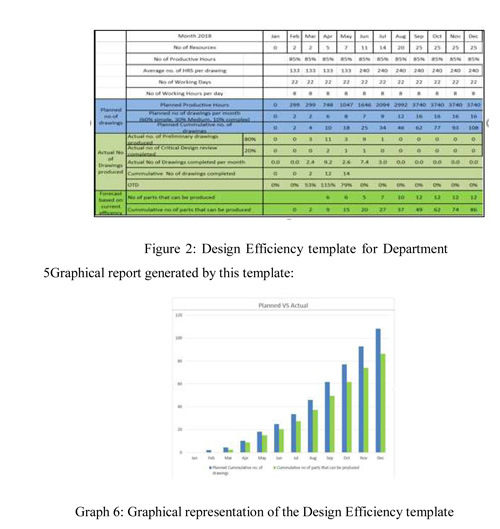
Graph 6: Graphical representation of the Design Efficiency template
Inference:
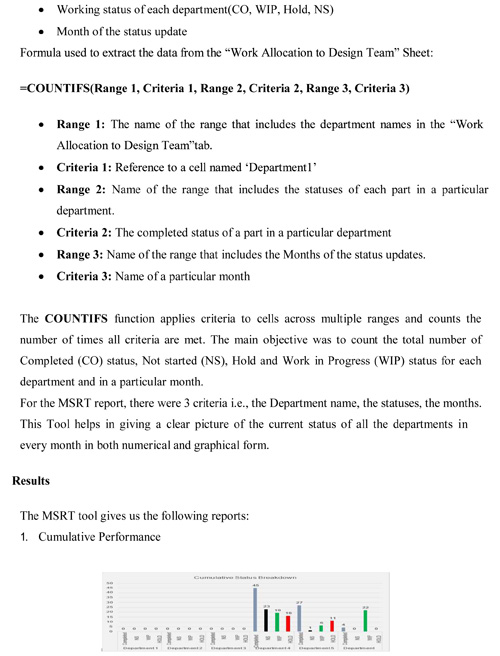
From the report generated using MSRT, following were the observations
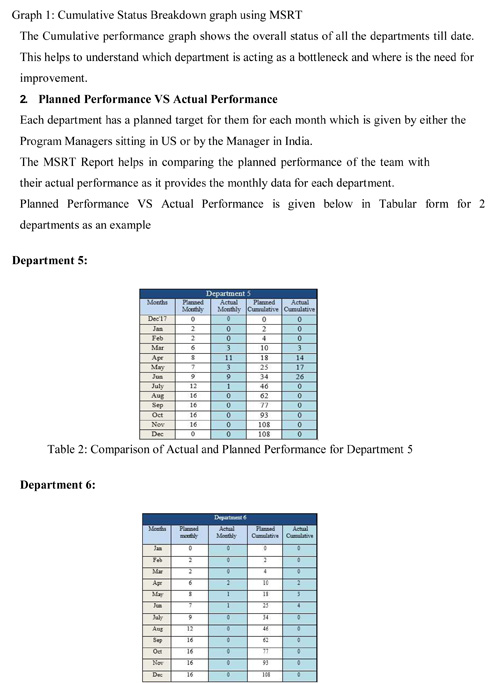
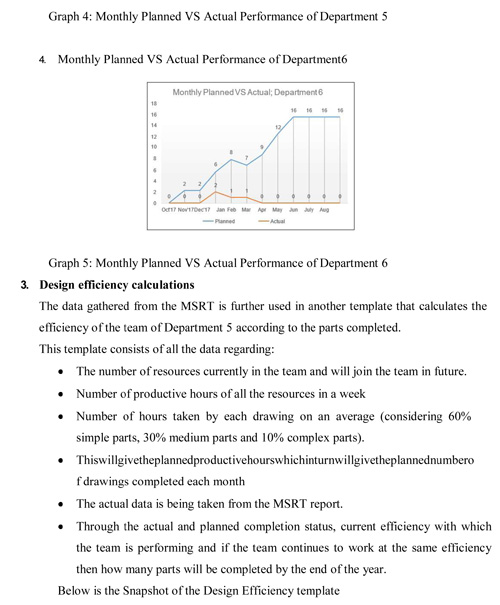
• Thegraphsgiveusthecomparisonbetweentheactualperformancesofthedepartments against the planned target on a monthly and cumulative basis.
• ThroughthegraphsweunderstoodthatDepartment6wasactingasthebottleneckasthe team’s actual performance was way behind the planned target.
• MainreasonbehindthedelayintheperformancewasthatthepartsweresenttotheSouth California team and they were taking months to approve a design and send it to India.
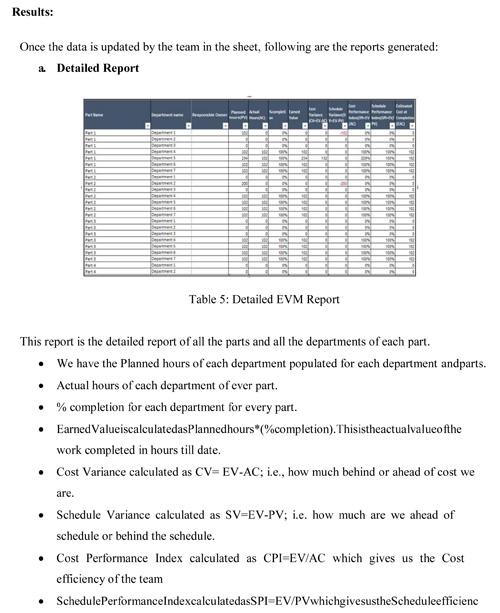
4. EVM (Earned Value Management)
Introduction
This is a performance measurement tool which would equip the user to monitor the project progress based on variances in the planned work hours with the actual work hours of the work completed. The tracker can be used for Cost and Schedule Control which can further be used for project forecasting and efficiency management. The expected inputs for this tool to calculate the performance index are the
• Planned Value-This is the first element of earned value management. Planned Value is the approved value of the work to be completed in a given time. It is the value that the team should have been earned as per the schedule.
We calculate Planned Value before actually doing the work, which also serves as a baseline. Total Planned Value for the project is known as Budget at Completion (BAC).
• ActualCost-Thisisthesecondelementofearnedvaluemanagement.ActualCostisthetotal cost incurred for the actual work completed to date. Simply put, it is the amount of money we have spent to date.
• Percentage completion- It is the percentage of completion of a part or design that a particular team in a department does.
Using these inputs from the team, following are the outputs that we get.
• Earned Value-This is the third element of earned value management. Earned Value is the value of the work actually completed to date. If the project is terminated to-day, also known as Budgeted Cost of Work Performed (BCWP).
There is a difference between Planned Value and Earned Value. Planned Value shows us how much value we have planned to earn in a given time, while Earned Value shows how much value we have actually earned on the project.
In the case of the design team, the earned value was calculated by using the planned hours and the percentage completion of the task.
• Cost Variance- It is the difference between the Earned value and the Actual hours, which tells us if the project is under or over budget.
CV= EV-AC
If the project is over budget the CV will be negative (i.e. achieved less than spent) If the project is on budget the CV = 0
If the project is under budget the CV will be positive (i.e. achieved more than spent)
• Schedule Variance- It is the difference between PV and EV, to tell whether the pro-ject work is ahead of / on / behind schedule
SV = EV – PV
If the project is behind schedule the SV will be negative (i.e. achieved less than what planned) If the project is on schedule the SV = 0
If the project is ahead of schedule the SV will be positive (i.e. achieved more than what planned)
• Cost Performance Index: The ratio between EV and AC, to reflect whether the pro-ject work is under / on / over budget in relative terms
CPI = EV/AC
If the project is over budget the CPI < 1 (i.e. achieved less than spent) If the project is on budget the CPI = 1
If the project is under budget the CPI > 1 (i.e. achieved more than spent)
• Schedule Performance Index: The ratio between EV and PV, to reflect whether the project work is ahead of / on / behind schedule in relative terms
SPI = EV/PV
If the project is behind schedule the SPI < 1 (i.e. achieved less than what planned) If the project is on schedule the SPI = 1
If the project is ahead of schedule the SPI > 1 (i.e. achieved more than what planned)
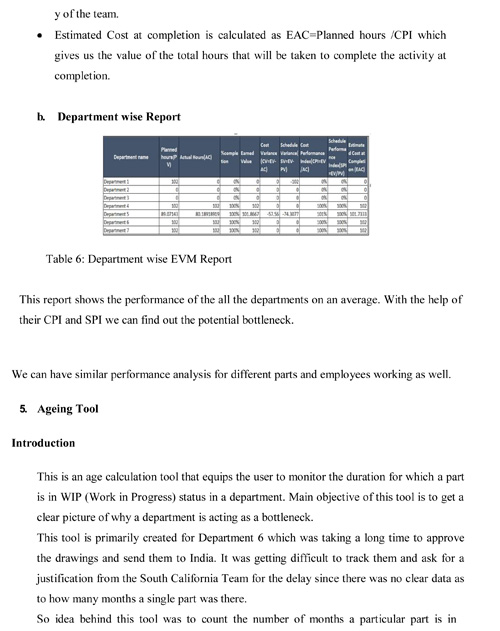
• Estimated Cost at Completion: As the project goes on, there may be variations into the actual final cost from the planned final cost, EAC is away to project/estimate the planned cost at project finish based on the currently available data
The following formulas can be used to calculate EAC based on which information and conditions given in the question:
EAC = BAC/CPI
Inputs Required:
• Planned hours given by the managers to each department for a particular part.
• Actual hours completed by the department
• % completion till date of each department for a particular part.
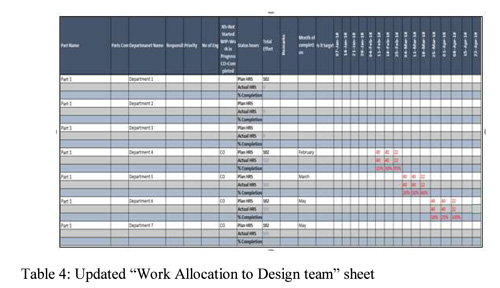
The team will put the above data in the “Work Allocation to Design Team” sheet (as men-tioned above) that is circulated to them. Planned hours will be updated against the planned hours column for respective departments and parts, the actual hours against the actual hours column under respective weeks and the percentage completion will be updated against the % completion column under respective weeks for respective part and departments.
Below is the snapshot of the updated “Work allocation to design team” sheet.
Risk Register
Introduction:
A Risk Register, also referred to as a Risk Log, is a master document which is created dur-ing the early stages of the project. It is a tool that plays an important part in your Risk Man-agement Plan, helping to track issues and address problems as they arise.
The Risk Register will generally be shared between project stakeholders, allowing those in-volved in the project to be kept aware of issues and providing a means of tracking the re-sponse to issues.
Components of a Risk Register
There is no standard list of components that should be included in the risk register. The Project Management Institute Body of Knowledge (PMBOK) and PRINCE2 among other organiza-tions make recommendations for risk register contents, but they are not set in stone. Some of the most widely used components are as follows:
• Dates:Astheregisterisalivingdocument,itisimportanttorecordthedatethatrisksare identified or modified.
• Description of the Risk: A phrase that describes the risk.
• Risk Type : Business risk, project risk or stage risk
• Likelihood of Occurrence: Provides an assessment on how likely it is that this risk will occur. Examples are: L-Low (, M-Medium (31-70%), H-High (>70%).
• Severity of Effect: Provides an assessment of the impact that the occurrence of this risk would have on the project.
• Countermeasures: Actions to be taken to prevent, reduce, or transfer the risk. This may include production of contingency plans.
• Owner: The individual responsible for ensuring that risks are appropriately en-gaged with counter measures undertaken.
• Status:Indicates whether this is a current risk or if risk can no longer a rise and impact the project. Example classifications are: C-current or E-ended.
• Other columns such as quantitative value can also be added if appropriate.
Types of risks identified
The types of risks associated with the New Facility Projects were:
• Executive Support
Wavering, inconsistent or weak executive commitment is often a project's biggest risk.
• Scope
The quality of our estimates, dependencies and scope management. If an estimate is just a guess, that's a risk.
• Change Management
A continuous flow of complex change requests can escalate the complexity of our project and throw it off course.
• Stakeholders
Stakeholders with a negative attitude towards a project may intentionally throw up roadblocks every step of the way. Conflict or a lack of cooperation between stake-holders is a risk.
• Resources &Team
Resource issues such as turnover and learning curves was a common project risks.
• Design
The feasibility and flexibility of architecture and design are key to the project's suc-cess. Low quality design is a risk.
• Technical
The risk that components of our technology stack will be low quality. There are doz-ens of quality factors for technical components (e.g. stability, availability, scalability, usability, security, extensibility).
• Integration
Whatever we are delivering needs to integrate with the processes, systems, organ-izations, culture and knowledge of the environment. Integration risks are com-mon.
• Communication
Invalid stakeholder expectations are a fundamental project risk. If the stakeholders think we are building an orange but we're building an apple — our project will fail.
• Requirements
Garbage in, garbage out. If requirements aren't feasible or are detached from business realities, our project may fail.
• Decision Quality
Slow, low quality or ambiguous decisions are common risks.
• Feasibility
Risk identification is a critical time to consider the feasibility of the project. Ask the key members of the team to do their own sanity checks.
• Procurement
The procurement process is ripe with risks. For example, there's a risk that we won't find an acceptable proposal to an RFP.
• Quality
Quality and risk management are intertwined. We'll expect to have defects in our project. However, there's a risk that quality won't meet basic levels.
• Authority
Project teams often lack authority to complete project work. In many cases, teams are expected to influence to achieve project objectives.
• Approvals & Red Tape
If we anticipate that red tape (e.g. financial approvals) will slow down our project — add this as a risk.
• Organizational
Organizational change (e.g. restructuring, mergers, and acquisitions) will throw our project off track.
• External
External forces such as laws, regulations and markets.
• Project Management
If our organization asks to streamline our project management methodology (drop processes and documentation) we can document this as a risk.
• User Acceptance
There's always a chance that users will reject our product.
a. Additional Contribution
• Understood the project management activities and the role of the Project Man-ager by shadowing the Project Manager in various meetings
• Prepared project plans for the New Facility Project. Learned MS Project and cre-ated some small Project Plans that include the activities related to the initiation of the facility, different qualifications of the electronic device etc.
• Understood the documents sent by the Smithfield Program Manager about the working of the device. Helped the manager understand the meaning of Red Label, Blue, Label and Black Label (certifications required to produce an electronic prod-uct).
• Attended various meetings with different team managers, engineers and other stakeholders.
• Understood how the work was allocated to the team members and how their prob-lems were addressed.
• Prepared minutes of the meeting and circulated that among the managers.
• Did rigorous brain storming sessions with the manager regarding the In sourcing Pro-ject and the cost estimation sheet for the Facility project and contributed in creating the cost estimation sheet of our own.
• Understood various elements like Learning Curve, Materials lope and how a labour head cost is calculated.
• Updated the In sourcing Project tools multiple times as and when required by the managers and the teams.
• Created a user manual for the team for them to use the tools without any problem.
• Used to go to the functional manager alone to get the weekly data whenever the manager was not there.
• Used to work closely with the functional manager to understand their requirements and create a tool that is easily accessible by the manager and the team.
Summaries of Findings, Conclusions and Suggestions
Summary of Findings
• Thegraphsgiveusthecomparisonbetweentheactualperformancesofthedepartments against the planned target on a monthly and cumulative basis. (Source: Graph 2: Cumulative Planned VS Actual Performance of Departments)
• Through the graphs we understood that Department 6 was acting as the bottle-neck as the team’s actual performance was way behind the planned target. (Source: Graph3: Cumulative Planned VS Actual Performance of Department6)
• MainreasonbehindthedelayintheperformancewasthatthepartsweresenttotheSouth California team and they were taking months to approve a design and send it to India.
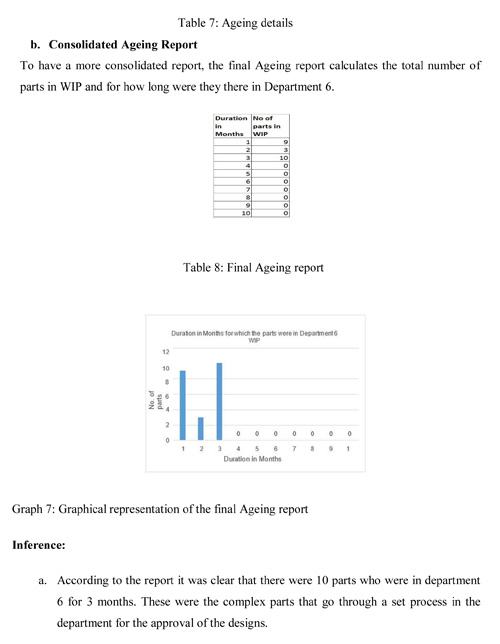
• According to the report it was clear that there were 10 parts who were in department 6 for 3 months.Thesewerethecomplexpartsthatgothroughasetprocessinthedepartmentforthe approval of the designs. (Source: Table 8: Final Ageing report)
• The 9 parts who were in the department for 1 month were the simple parts (Source: Table 8: Final Ageing report)
• 3 parts were the medium complexity parts that were in the department for 2 months. (Source: Table 8: Final Ageing report)
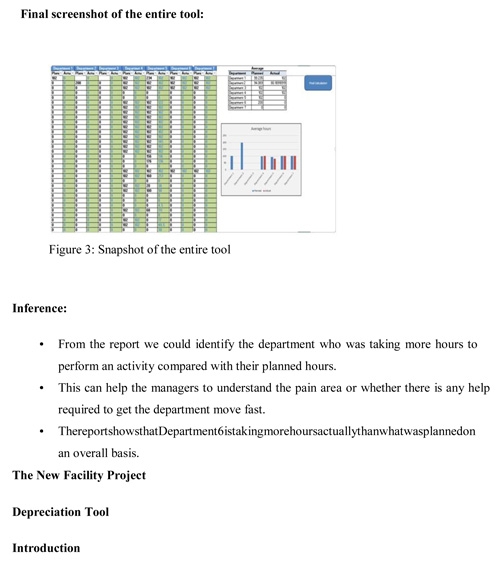
• From the report we could identify the department who was taking more hours to per-form an activity compared with their planned hours. (Source: Table 9: Populated data planned vs actual hours)
• Thiscanhelpthemanagerstounderstandthepainareaorwhetherthereisanyhelprequired to get the department move fast.
• The report shows that Department 6 is taking more hours actually than what was planned on an overall basis. (Source: Table 9: Populated data planned vs actual hours)
Achievements
The MSRT tool was widely appreciated and acknowledge by the US team.
According to them, this level of detailed tracking wasn’t being done in any of the 5 places in the world where In sourcing Project is being carried out. They asked for the tool and have planned to implement it in their projects and other related projects also. The Reports generated by the tools
i.e. MSRT, EVM, Ageing and Planned VS Actual are being shown to the Boeing India head.
Suggestions
• No specific scale of reference was there for the team. To track their efficiency.
• Different teams were using different trackers to track their performance which creat-ed an issue of lack of comparisons between the departments. All the departments must get in line with each other and use 1 way of tracking the project after a mutual-consensus.
• There should be some skip level interviews also conducted. As an individual, there is always a room for improvement. If a manager has the authority to review a subordi-nate, then the subordinate must also have an authority to give a review about the manager to his manager.
• Efficiencyoftheteamshouldbecheckedatleasttwiceamonthtoensuretheyareontrackand the performance is as per the target.
Conclusion
Since the organization was fairly new in India, there were lot of issues in overall implemen-tation of the new business. Some of the issues were:
• Lack of project management infrastructure to identify the gaps, pain areas, effi-ciency and productivity existed in the process of design and manufacturing.
• The organization was struggling to plan the approach for setting up their new facility.
Main role was to address these issues and provide the management with an approach that would help in easy monitoring the progress and productivity of the organization.
MS- Excel was extensively used to develop read and analyze data and eventually develop a tool that would help providing with a solution.
The below mentioned tools that were developed have, to much extent, provided the much needed solution and direction of thought for future developments.
• MSRT (Monthly Status Reporting Tool)
• EVM (Earned Value Management)
• Ageing Tool
• Planned VS Actual Hours
• Straight Line Depreciation
This study was conducted in the year 2018, but it becomes more relevant now amidst the ongo-ing Corona virus pandemic. Much of manufacturing production world-wide has been organized in what has become known as global value chains (GVCs). The effect of virus containment measures is visible in data on industrial production in China, which has fallen by 13.5 per cent in January and February combined, compared with the previous year. This drop in production is severe, in particular when putting it into a longer perspective: neither the SARS outbreak in 2002/2003 nor the financial crisis in 2008/2009 was associated with any such stark drop in pro-duction.China’s position at the heart of many GVCs is explained by the fact that the production decline is also associated with major contractions in international trade flows. The country's im-ports decreased by 4 per cent in US dollar terms in January and February combined from the same period a year earlier, while exports dropped by 17 per cent over the same time period, ac-cording to the official Chinese trade statistics. Significant declines in imports are to be found among products that are used as intermediates in production, such as textiles, electric and elec-tronic equipment. Similarly, exports have also experienced strong decreases in these goods.
Many countries like America, Europe, Canada, Australia etc have been hit with supply chain shocks as the flow of materials from China was disrupted by the pandemic. CEOs are confiden-tially asking their supply chain teams to develop additional sources that are completely inde-pendent of China. India can benefit here as it is the biggest economy amongst the only five low cost countries including Mexico, Indonesia, Brazil and Thailand and it has the largest untapped potential for filling part of the supply chain vacuum that is created by exodus from China. Keep-ing in mind the advantages India provides, Boeing has more than one reason to come and set up a facility here.
Reference
Books:
Internal Project Reference Documents
• Business Requirement Documents- Cost Estimation Sheet Business Requirement docu-ments - Business Plan
• Business Requirement Documents - Documents regarding the device details Internal ref-erence Presentations.
Master Phasing Plans – Boeing, USA Internal Risk Registers (Ongoing projects).
Websites:
• Company Profile – The Boeing Company, accessed on 30/07/2018 https://www.boeing.com
• Risk Register, viewed on 30/07/2018, https://www.cio.com.au/article/401244/how_create_risk_register/
• https://www.brighthubpm.com/risk-management/3247-creating-a-risk-register-a-free-excel-template/
• Aerospace manufacturing Industry, viewed on 30/07/2018 https://www.aero-mag.com/