Behavioural finance and Investment decisions for Nascent investors
Abstract :
The field of behavioural finance is a vast and elaborate field that involves the study of hitherto less explored combinations of human factors like social, economic and personal inclinations towards finance and investments. It deals with the behaviours at a deeply personal level and also the correlation with the broader and external factors like markets and other investment avenues. Behavioural finance is to be looked at from a perspective of how an individual will address the anomalies arising out of common situations such as market fluctuations, risk patterns, geopolitical scenarios and personal goal setting with ROI as the standard of measurement. This paper will examine a range of such behavioural patterns and corresponding responses that an individual might take along with financial decisions.
Behavioural finance integrates economics with natural human tendencies. This domain tries to strike a balance between complex and futuristic finance and mathematical models, and how would a human behave in terms of personal trends, affiliations and perceptions around investments and finance. The models may tend to provide a statistical or an objective way of assessing the ROI but the subjective human behaviour also needs to be taken into consideration. Many aspects of human behaviour will influence the investment strategy such as herd behaviour, risk aversion, risk aggression, loss perception and community biases. This paper attempts to bring out these factors and analyze how they play a key role in an individual’s investment journey. The approach is to take practical instances in day-to-day living and explore further how these provide the real-time context of investments, with a special focus on nascent investors.
Investments have been practised ever since people started to pool their income, be it salary, wages, taking loans, or receiving interest. Their fundamental goal is to facilitate daily activities like household expenses, funding a child’s education, clearing the loans, purchasing items needed to run the household/business, paying the bills to ensure their tax liabilities are cleared, sanctioning the loans, domestic/international travel, donations to the underprivileged, social obligations and so on. In the present era, investments are possible in various ways and many options are available to the people in general. In the context of this paper, we will be discussing the investment options for nascent investors with a focus on the financial markets. Financial market instruments and investments have been used extensively across various age groups, the young and the old alike. The obvious goal and driver for such investments is to protect the capital, avoid losses to the extent possible and generate additional income through profits.
Traditional investments were focused on instruments like term deposits, life insurance, public provident fund, employee provident fund, metals like gold/silver and real estate. Though these do still maintain the value creation objectives, the new generation of investors is looking for alternate sources and is gravitating towards stock market investments lately. This generation quintessentially wants to participate in the latest developments across the globe, understand how businesses work, what are the triggers for world economic growth and how can they leverage this ecosystem to grow personally in terms of financial gains.
There is a large percentage of investors who are first-time investors also known as nascent investors. These categories of people tend to have some or no idea about investments. This paper tries to understand the behaviour, attitudes, perceptions, and values of nascent investors. The primary focus is to analyse and bridge the gap between the investors, their investment trends, individual perceptions, requirements, goals, risk analysis and emotional connections. The paper also attempts to address the intersection of human psychology and behaviour finance, the concepts provide the emotional connection. The concepts here delve into behaviours like overconfidence, herd mentality, disposition effect, biases in the investment choices, and strategies of individuals. In summary, nascent investors is an interesting domain that brings about different aspects of investment behaviour and the decisions taken in the investing process.
Keywords :
managerial - decision-making processes, complex systems, Ongoing research, organism.
Introduction
In the present era of investments or financial markets, investment decisions are governed not only by objectives or policies but also by individual views, perceptions, values, attitudes, and behaviour, which provides insights on choosing a wise investment decision. Each person has different goals, missions, values, and traditions, depending on one’s needs and requirements. In a broad sense, each decision can act as an important financial base to start with. When we tide over any emergencies, investors prefer to have short and long-term goals as an option, which would create a platform to understand what needs to be achieved through one’s financial decisions. The personality of each individual generally is different from an investment perspective, and ultimately has an overview of how the wealth needs to be spent or distributed after a certain period.
By understanding the requirements and their views towards investments, they can be bifurcated into different categories of investors, angel investors, personal investors, institutional investors, nascent investors, and venture capitalists. One of the categories will be nascent investors, who are relatively new to investment ventures, and portfolio management, and are characterised by their novelty towards the different complexities of investing. These investors are generally first-time investors who generally pool a small amount of funds to build a better portfolio in the near to mid-term. Nascent investors are generally less or have zero knowledge towards portfolio management and sometimes seek assistance from experts and financial advisors
These categories of people are generally risk-averse individuals who are less likely to go for risky investments but there could also be those set of enterprising young investors who want to take the challenge of investments in equities or direct trading. Nascent investors typically pick portfolios based on the following factors:
- Risk-Tolerance
- Time value
- Investment Goals
- Market conditions & Rate of Returns
Research Methodology
The topic of behavioural finance for nascent investors is very interesting and trending amongst the new generation, and this needs a thorough investigation covering all key aspects of investments in this journey. The best possible way was to check with the target audience about these areas and this was accomplished by launching a data survey containing key questions about the same. This primary data source was circulated across geographies and age groups to get a sense of the information required for this research. The responses were then analyzed and the outcome of this has been presented in the subsequent sections of this paper.
Sampling Unit & Area
Various geographical locations in India and Abroad were considered for the research
Primary Data Sample Size
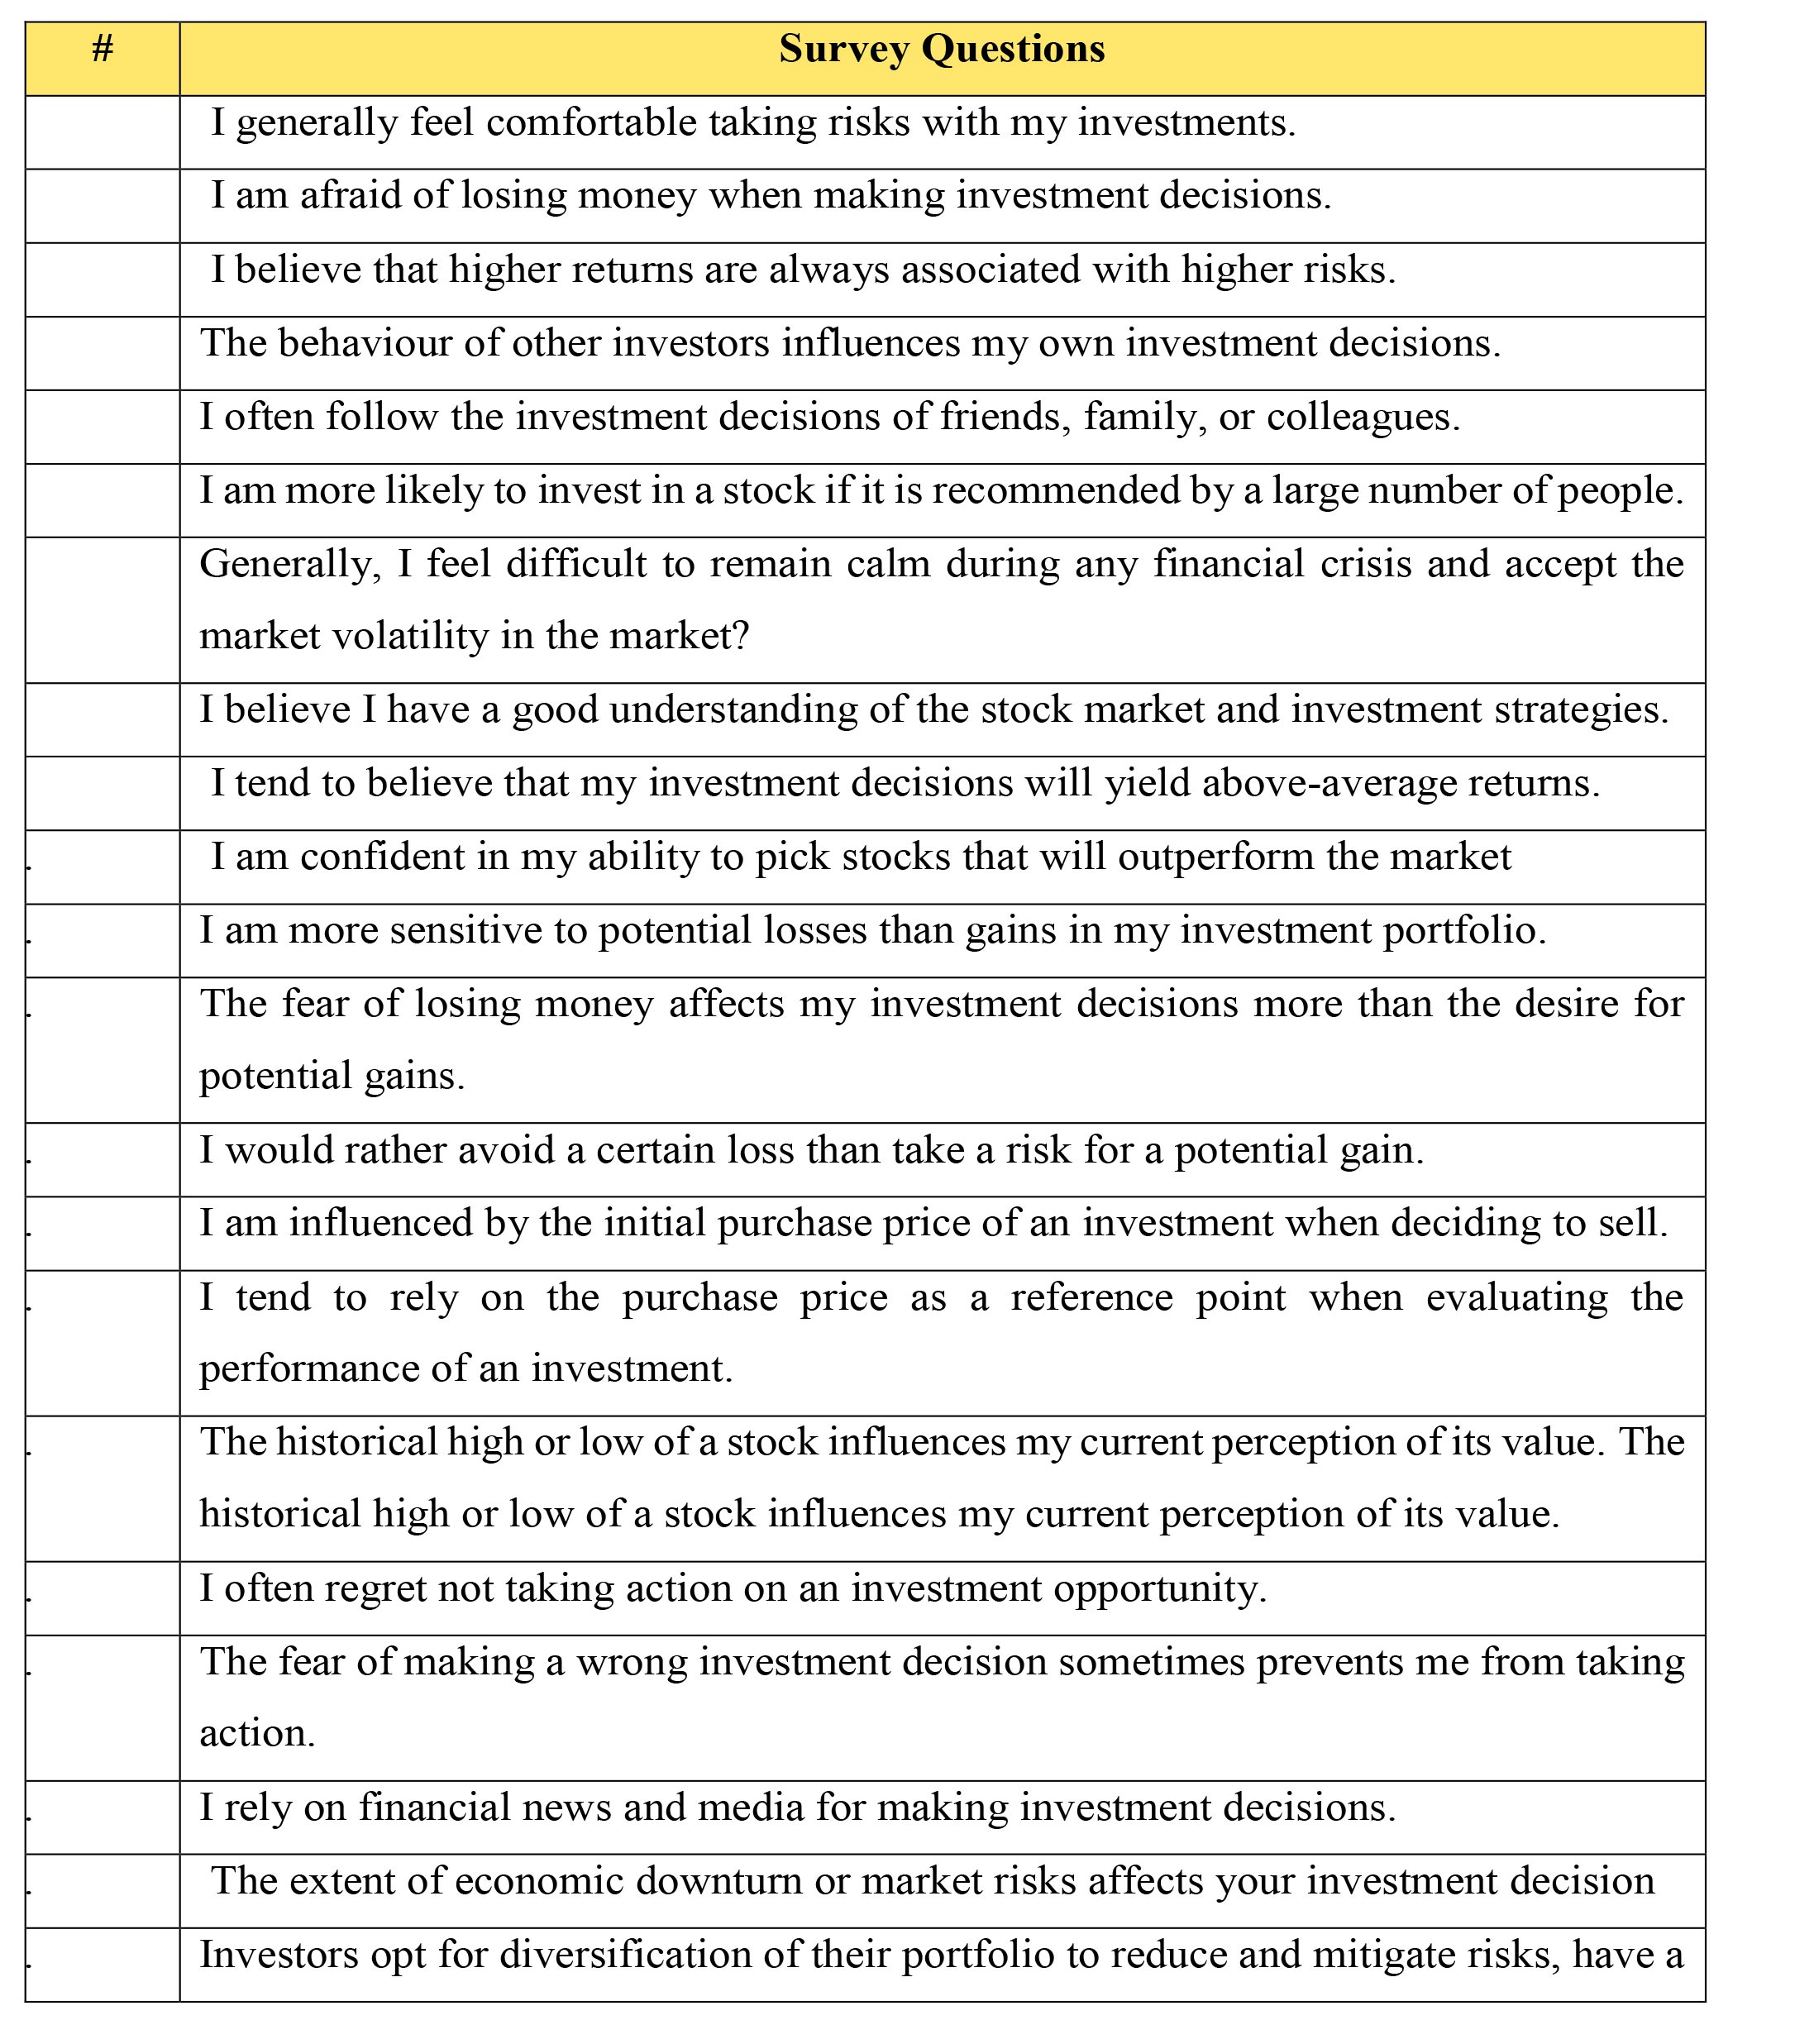
The survey that was launched had around 300 responses and the questions that were posed to the audience are provided below. The respondents were requested to provide answers assuming that they were nascent investors, in the scenarios where they had already begun investing.
 Survey Link: Behavioral Finance and Investment Decisions for Nascent Investors (google.com)
Tool Used for Research Analysis
Survey Link: Behavioral Finance and Investment Decisions for Nascent Investors (google.com)
Tool Used for Research Analysis
The research analysis was conducted by using the tool
Partial Least Squares- Structural Equation Modelling (PLS-SEM) through the inbuilt statistical technique. This is basically used to construct Structural equation models that are used to estimate the root cause of one variable that can have an effect on the subsequent variables (Cause-effect relationship) taking the hidden variables into consideration. The model is used when the objective of the research is to predict the required outcome or when the given data distribution lacks normality.
Structural Equation Modelling – The model here is used to perform a multivariate data analysis for understanding different constructs and indicators. The technique here uses a Causal predictive approach to the SEM to predict the results of the models and also to explain the root cause for the deviations in the model.
In the following research, we have used the SEM model analysis and the steps used are as follows:
- First, we have used primary data by collecting the responses through a questionnaire to perform our analysis. Once the data is generated, we tend to look out for keywords from different questions. These keywords form the basis for our Constructs by choosing the words from different buckets.
- Once the keywords are identified, we tend to build a suitable construct that identifies the latent variables, independent, and dependent variables.
- Once the variables are analysed, we tend to connect each keyword with the latent variable, and once the constructs are ready, we proceed with the SEM predictive analysis. Latent variables are fundamental constructs that can’t be directly measured but only be inferred from other variables.
Research Analysis
The keywords that are collected from the questionnaire are taken to perform different constructs, which are used to determine the latent, independent, and dependent variables. As our research is based on investment decisions for nascent investors, the following can be recorded as the variables.
The key focus is to determine the appropriate stocks that investors can choose to make the investment decision. Nascent investors must thoroughly analyse the market to choose an optimum portfolio. The constructs here indicate that the
dependent variable is
Choice of Stock which is dependent on different factors to make a better investment decision. The
independent variables include:
- Comfort
- HR (High Returns)
- Recommendation
- Financial crisis
- Awareness
Path Coefficient for Dependent and Independent Variables
The PLM-SEM tool is then used to generate the below matrix which indicates the Path Coefficients that are used to measure the strength of direct relationship between two variables. The Path Coefficient is a statistical tool that helps to bring out the direction of influence between variables and the strength of the relationships and is usually between -1 and 1.
- Positive coefficient shows that in a positive relationship, an increase in one leads to an increase in the other
- Negative coefficient shows that in a negative relationship, an increase in one leads to a decrease in the other
- The closer the coefficient is to 1, the stronger is the direct effect
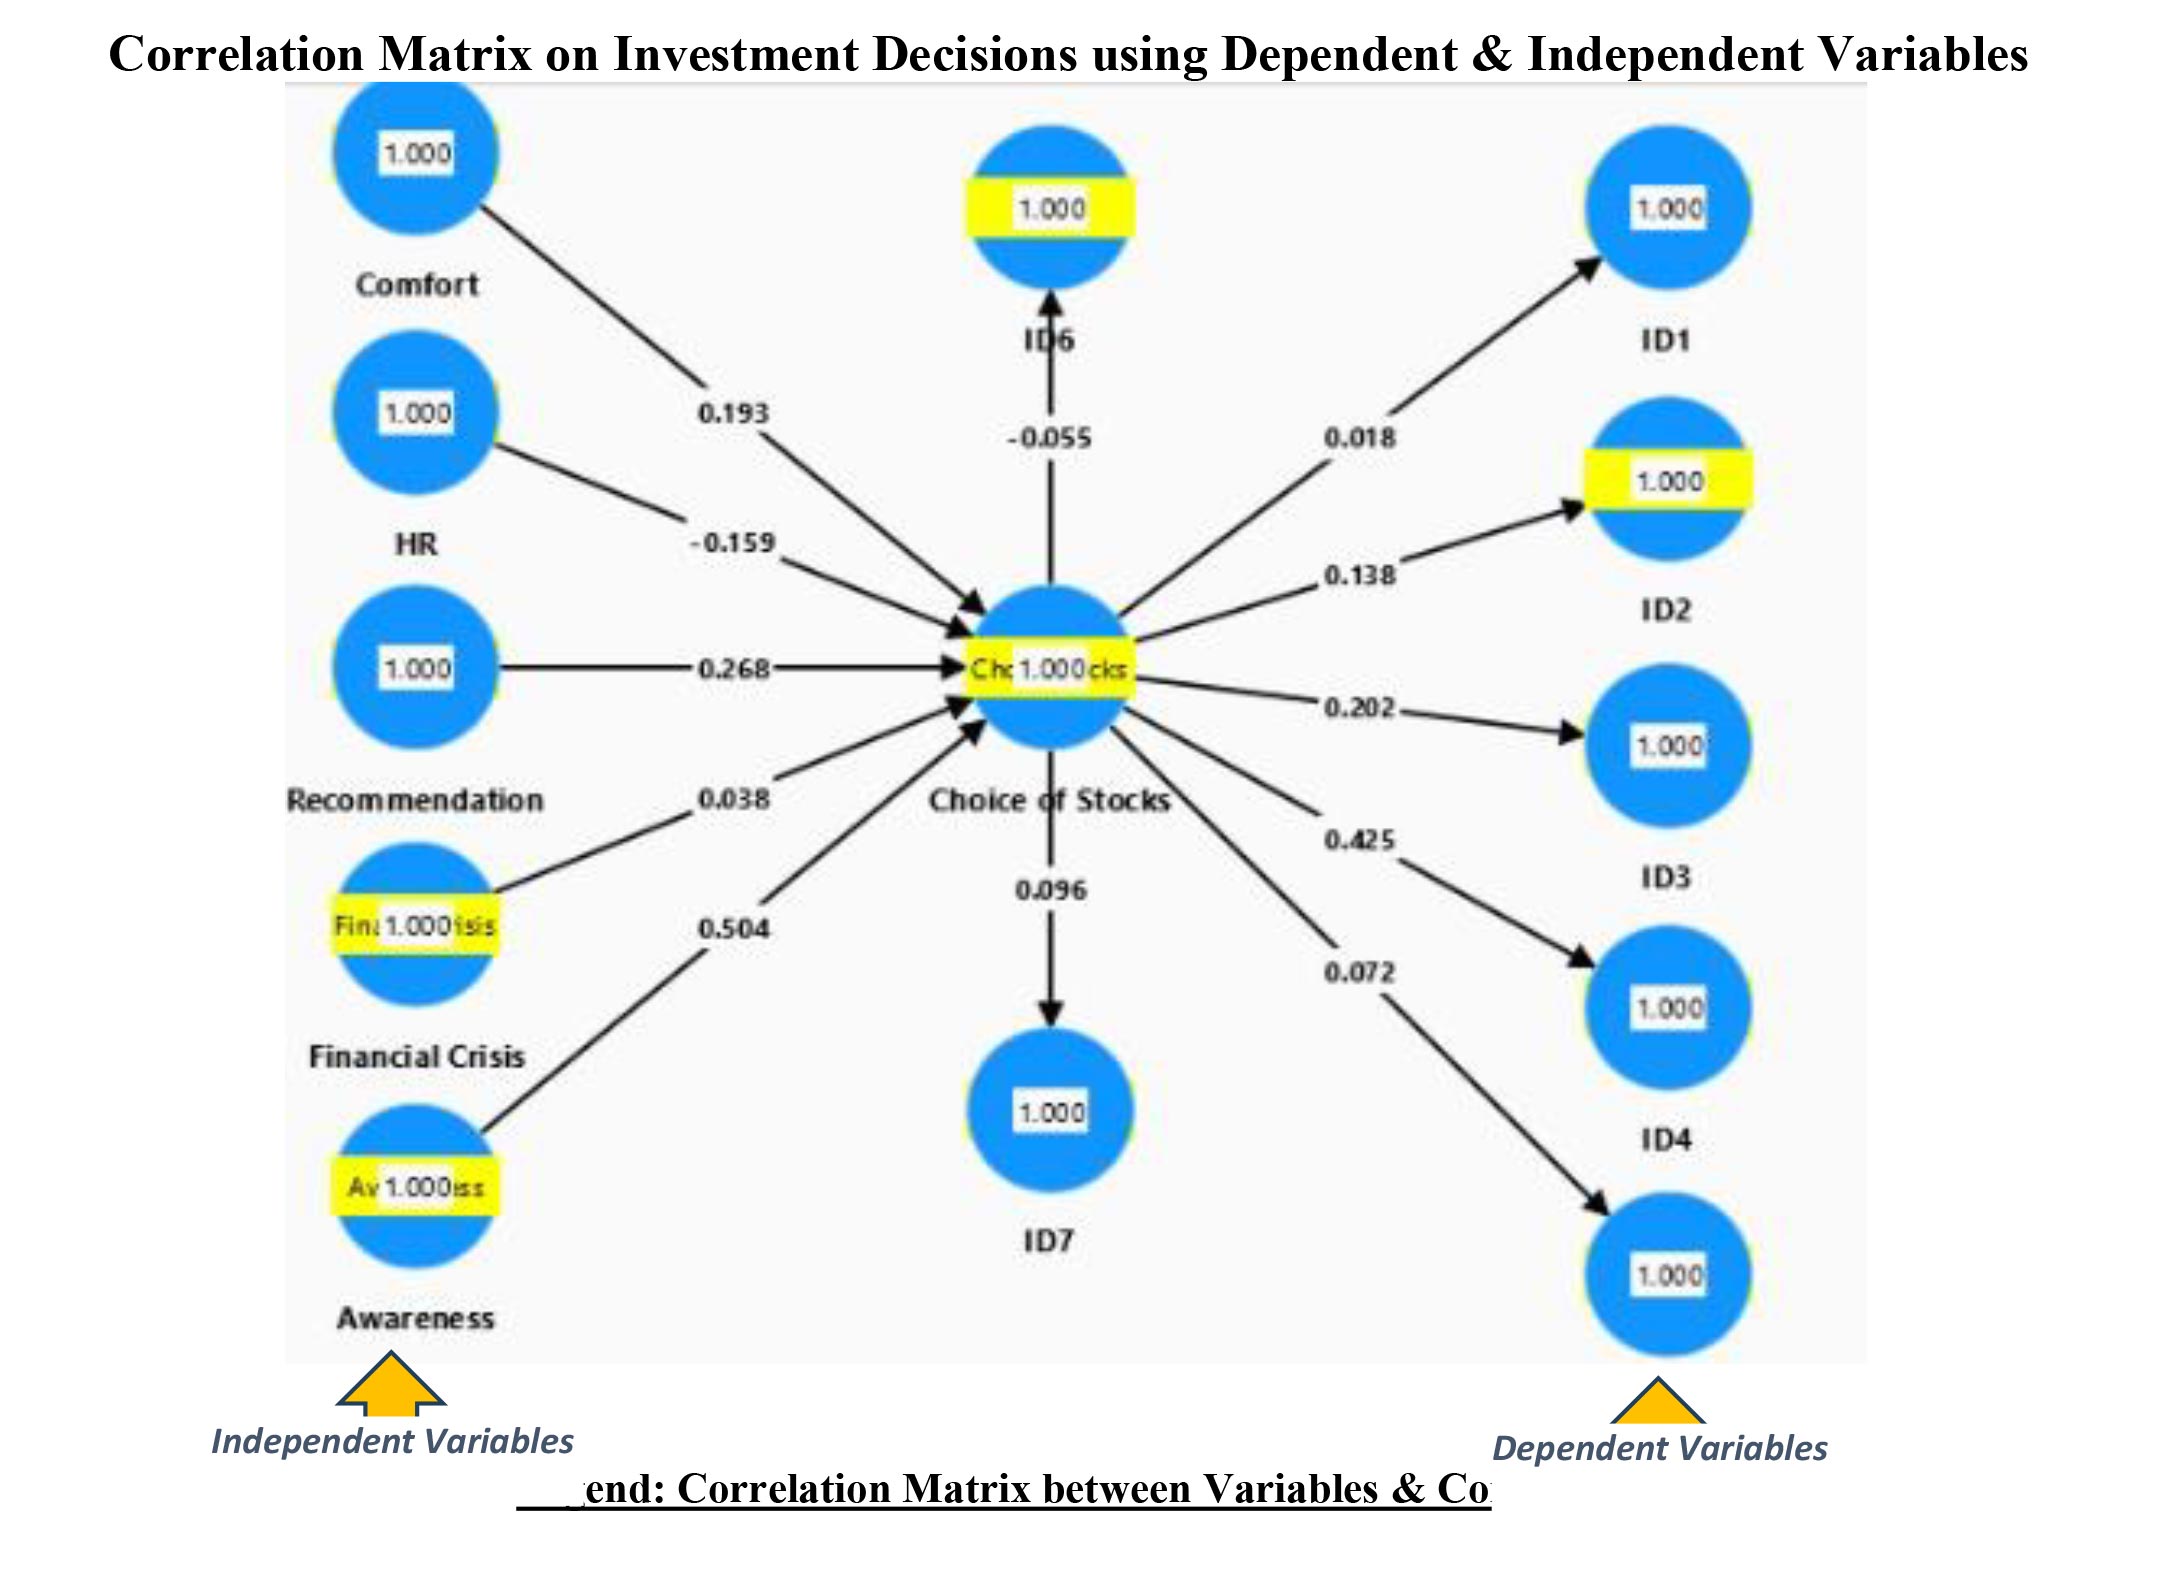
The matrix clearly explains the relationships among the variables for our research data. The test here explains the path coefficients which includes the statistical measures which are used to perform the path analysis and to evaluate the reason-effect relationship among the variables. The analysis indicates the factors that would influence people’s recommendation of stocks.
The values according to path coefficients mentioned in the table above are:
- Awar: 0.504 (Awareness)
- Com: 0.193 (Comfort)
- F&C: 0.038 (Financial Comfort & Choice of Stocks)
- HR: -0.159 (High Returns)
- Recom: 0.268 (Recommendation)
As per the analysis of the path coefficient model, variable1 (Awar 0.504) Awareness has a relatively positive influence on the Choice of Stocks, which has a strong linear relationship with each other. This shows that people are comfortable in making suitable investments and are aware of the stock market, and are open to choosing any stock for their investment.
On the other hand, the path coefficient value of variable 2 (HR -0.159) High Returns, indicates a combination of positive and negative relationship between the two variables. It means that the investors may have a lower probability of receiving higher returns even when the choice of stock is generally good. This could potentially be due to a few external factors like geopolitical situations, global financial crisis and health issues like the pandemic.
Latent variables are those that can only be interpreted indirectly through SEM modelling from other measurable variables. Such variables bring out the interlinkages between other observable variables and help in getting a sense of the subjective aspects of the data. Examples of latent variables could be investor satisfaction, perception, overconfidence, behavioural attributes and so on.
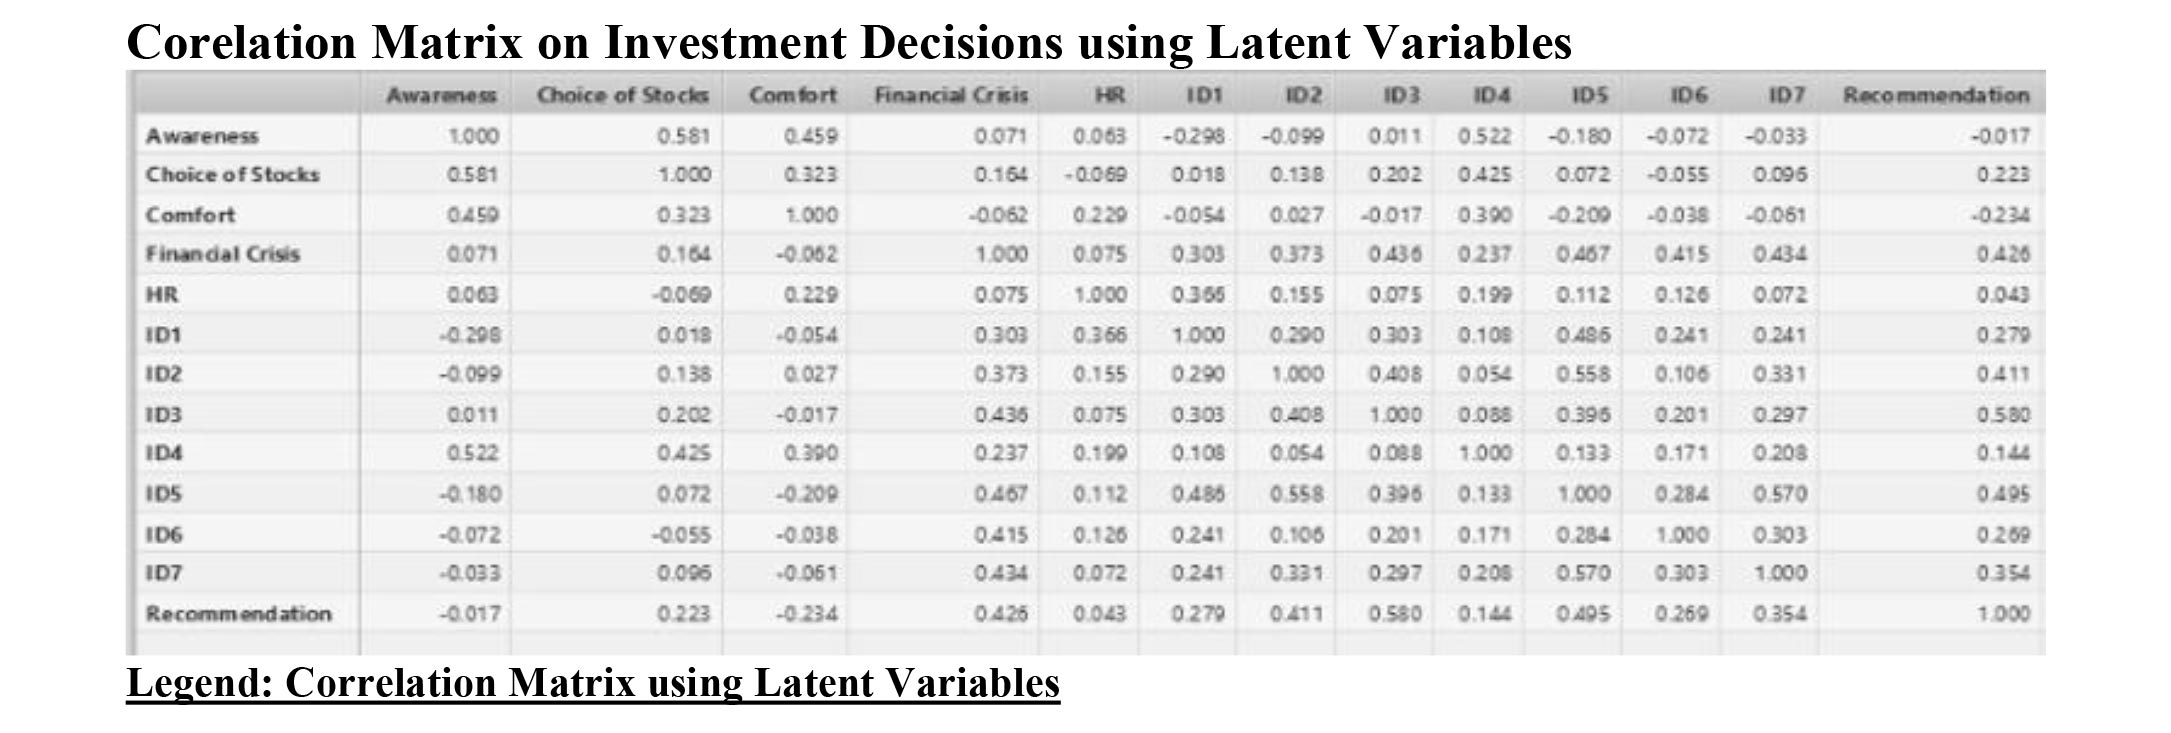
The matrix above provides a deeper level correlation of variables through which one needs to interpret the latent variables and their associated impact in our analysis.
Interpretation of Matrix through Latent Variables
We will take a few correlations in the matrix to unearth the latent variables and their context with the investors.
- For instance, the matrix indicates the relationship between Variable 1 (Awareness) and Variable 2 (Choice of Stocks) which is 0.581. This shows that there is a moderately positive relationship among these variables. It also implies that investors are more cognizant of the stock market and are open to choosing an appropriate portfolio as per their requirements. The latent variables here could be “knowledge” and “belief” about their portfolio.
- Between Variable 1 (ID1) and Variable 2 (Awareness), we can see a weak and negative correlation of -0.298. This may mean that the awareness of the investments is not satisfactory, leading to a negative value. The latent variable could be “overconfidence”.
- Between Variable 1 (ID3) and Variable 2 (Recommendation), the matrix shows a moderate positive correlation value of 0.580. The interpretation we can draw is that investors are open to investments which are recommended by financial experts, peer groups, advisors and so on. The latent variables could be “confidence”, “trust”, “belief”, and “knowledge”.R-Squared Analysis
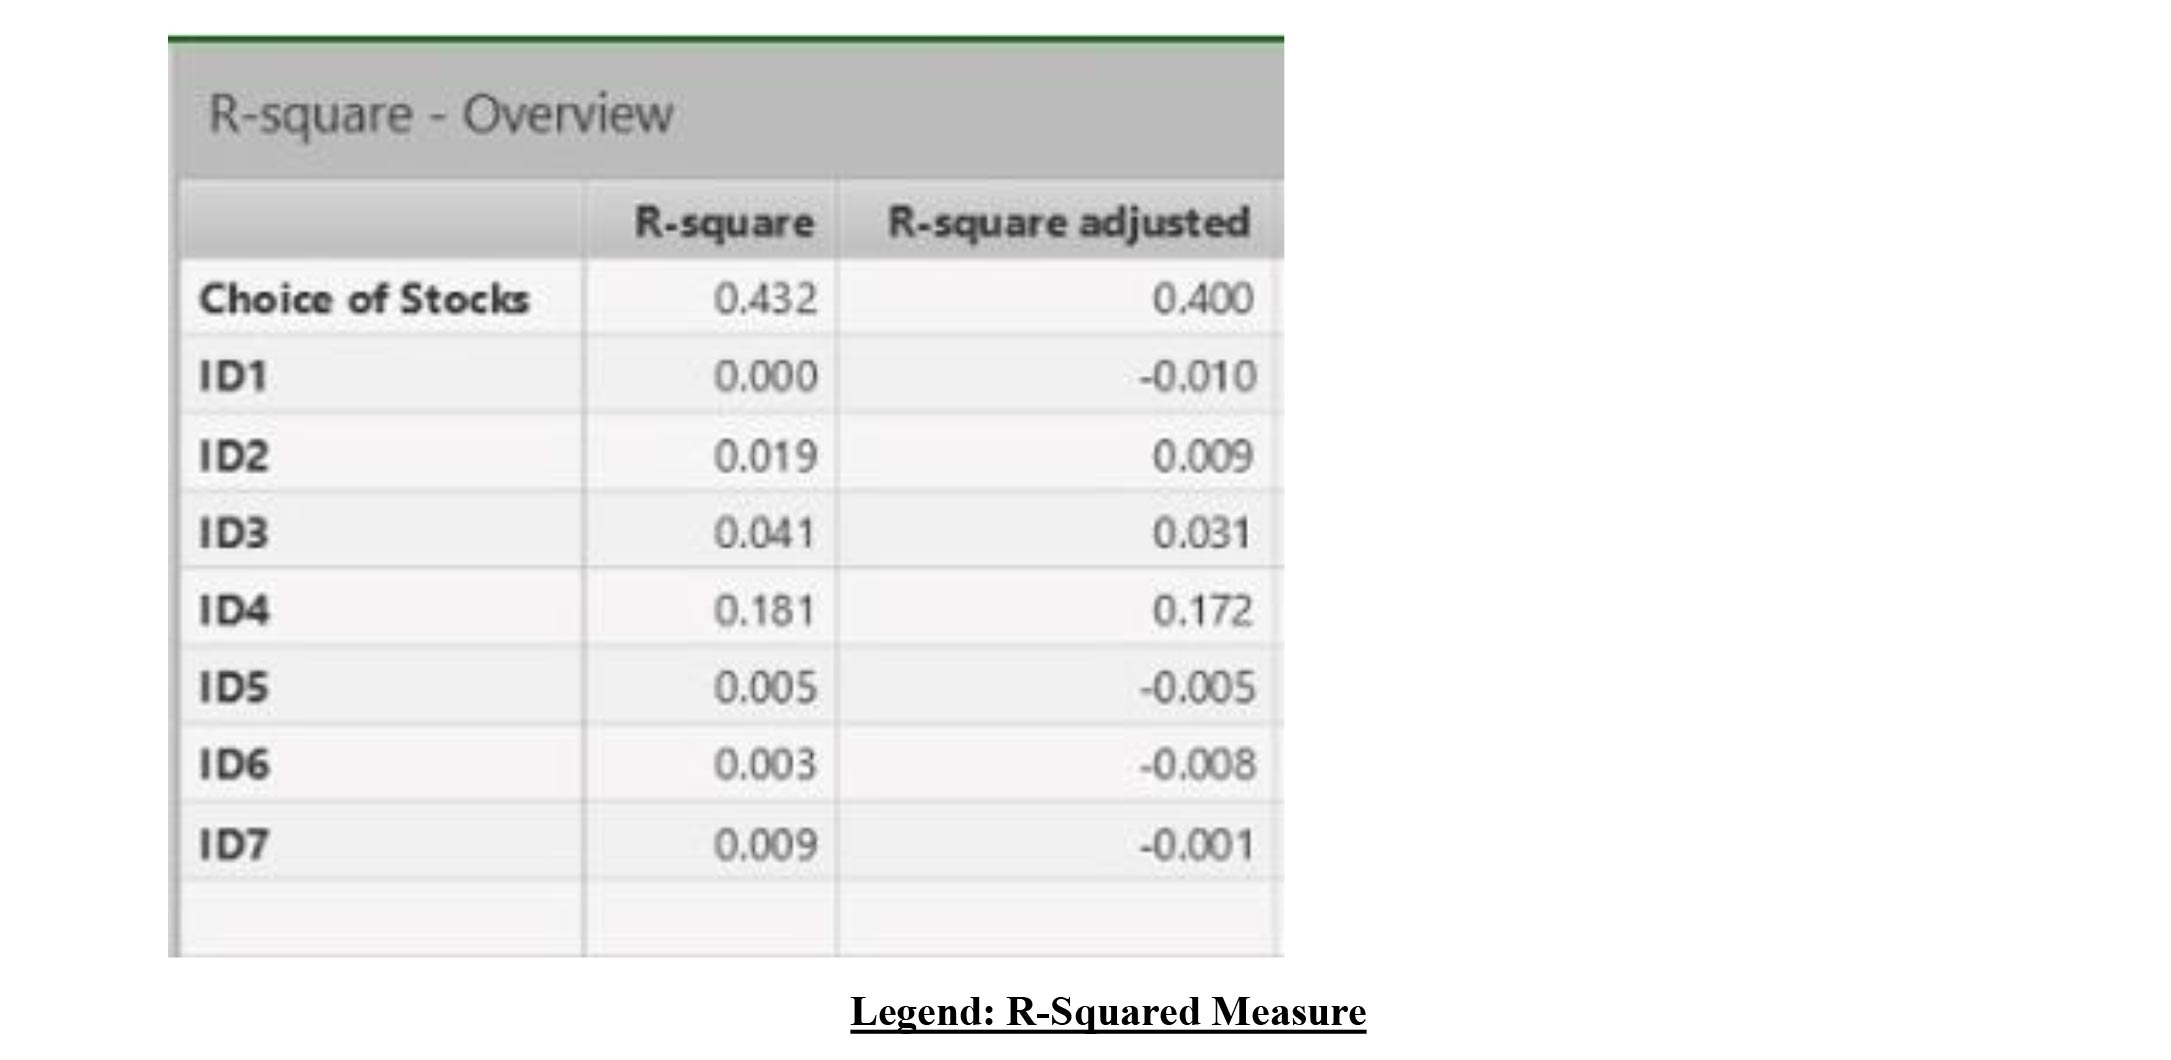
A statistical measure denoted as R-squared (R2) determines the predictability of the variance in dependent variables. The value of R² is usually between the range of 0 and 1.
- Closer to 1: It indicates a better fit. High % of the variance in the dependent variable (for example, 0.7 will indicate 70% of the variance is explained)
- Closer to 0: It indicates a lower fit. Weak relationship between the dependent and independent variables
Let us consider a few scenarios to understand how R-squared measures can be interpreted. The idea is to correlate the dependent variables and independent variables to arrive at an informed analysis.
Scenario 1:
Dependent Variable: Choice of Stocks
Independent Variable: Ex. Awareness
Interpretation: The value of the Choice of Stocks is
43.2% which means the model predicts nearly 43.2% of stock choices are explained by independent variables ex. Awareness. This means Awareness, the independent variable, influences the stock selection.
Scenario 2:
Dependent Variable: ID4
Independent Variable: Ex. Financial Crisis
F-Squared Analysis
The
F-Square model predicts the effects of specific independent variables on dependent or latent variables. While the R-squared model shows how well the independent variables (entire model) influence the dependent variables, the F-squared model focuses on individual independent variable contribution to a dependent variable.
The table below provides a snapshot from the PLS-SEM tool for the F-squared measure for a few of the variables that are part of this research.
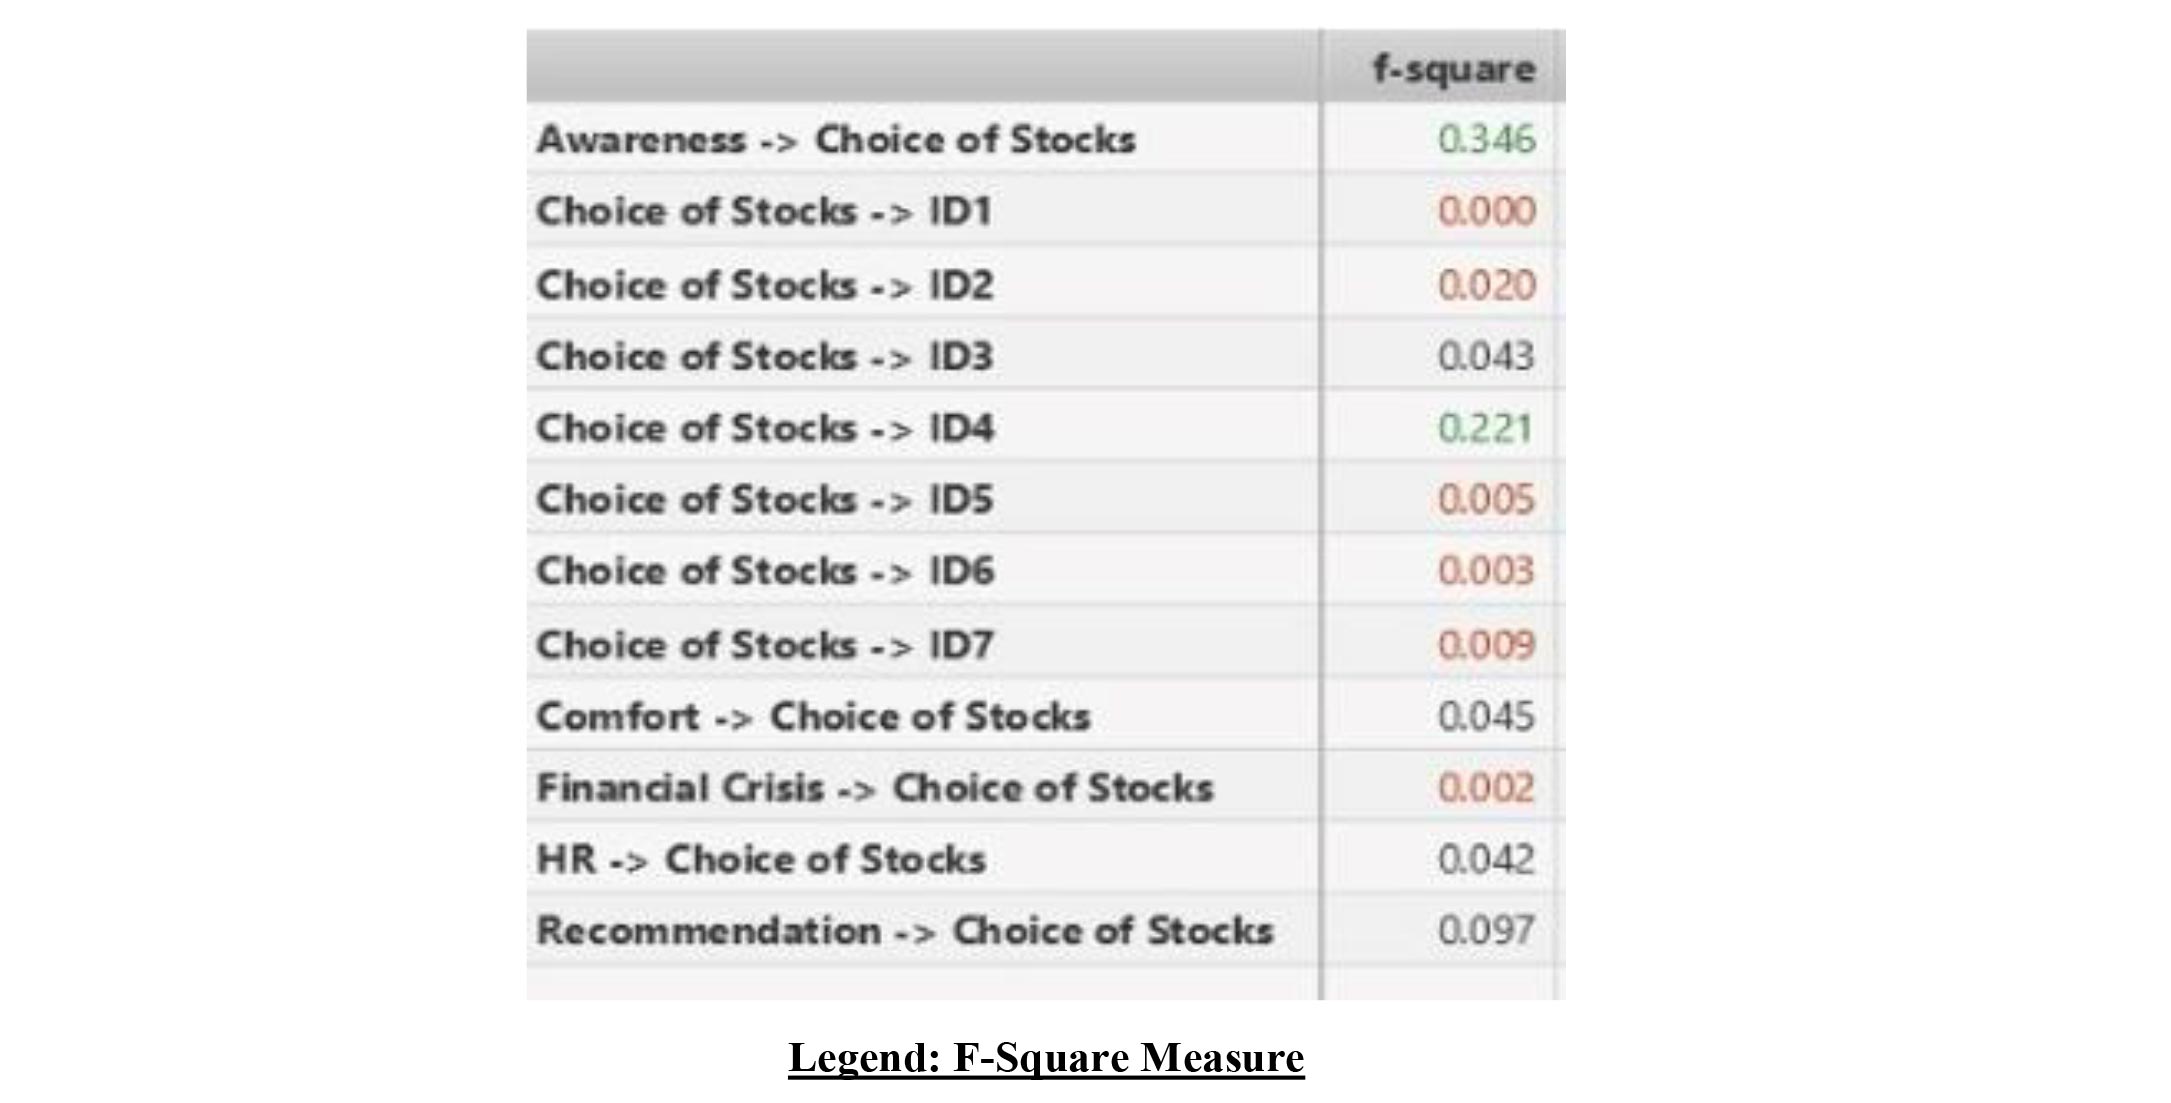 Scenario 1:
Dependent Variable: Choice of Stocks
Independent Variable: Awareness
Interpretation: The F-squared value of 0.346 indicates that good Awareness has a positive effect on the Choice of Stocks. In the research context, it can be interpreted that 34.6% of investors had awareness of market conditions, volatility, stock performance and so on that led to their choice of portfolio.
Scenario 2:
Dependent Variable: Choice of Stocks
Independent Variable: HR (High Returns)
Interpretation: The F-squared value of 0.042 indicates that high returns are not always expected from the choice of stocks. Our research data shows that, especially for the nascent investors who are risk averse, the stock selection is not always based on high return expectations.
Scenario 3:
Dependent Variable: Choice of Stocks
Independent Variable: Financial Crisis
Interpretation: The F-squared value of 0.002 indicates that a financial crisis may lead to the choice of stocks that may be affected due to behaviours such as fear, uncertainty, loss perception and pessimism. There may be a tendency to realign sell or drastically change the portfolio depending on the criticality of the financial crisis.
Based on the above sample scenarios, the F-Squared Analysis can be extended to other dependent and independent variables and we can arrive at our conclusions in terms of investor behavioural patterns and tendencies.
Discussion-based novelty of the research (Behavioural finance and investment decisions for nascent investors.)
- The Concept of Behavioural finance is concerned with investment decisions for nascent investors and focuses on understanding, the behavioural patterns, investment trends, psychological factors, investment trends, attitudes, and beliefs, of investors who are relatively new to the market. The study here shows various cases, research, and concepts, regarding factors such as overconfidence, perception, anchoring, cognitive dissonance, regret aversion, and narrow framing, which can have a significant impact on investors' decision-making. These psychological factors can lead investors to deviate from traditional financial theories.
- Prospect theory- the central theory of behavioural finance, is concerned with the prospect theory and was authored by Kahneman and Tversky. The paper here shows that people can make decisions which can add value by understanding the potential gains, and losses that are inevitable in any investment decisions. Investors have to understand that the market rate, fluctuations can be Bullish or bearish. So by understanding the market rate, volatility, and ROI investors can choose a suitable portfolio that would generate sufficient returns.
- Impact of Nascent Investors- The new investors who are entering into market are generally equipped with, certain Biases, and heuristics which can impact their decision-making process. These are subjected to certain trends and emotional biases, that tend to have information gathered by peer groups, financial advisors, income level, friends’ colleagues etc the behaviours assist the investors in predicting new trends, plans of action, and strategies, which are valuable to the investors in choosing the finest investment decisions.
- Strategy implications- With the knowledge of behavioural finance, investors tend to choose the best strategies, that can help in understanding, their biases, and behaviours.
- Regularity consideration – Different regulations are equipped in the financial market, using the concept of behaviour finance. As a subject, it acts as a framework for setting the standards, policies, and rules systems, that help protect the interest of the investors, who are relatively new to the market.
In a nutshell, behavioural finance is a platform that offers valuable insights, for nascent investors, understanding the non-rational elements of decision-making, and also assists the investors in choosing the best financial instruments, which provides a gateway for the new investors to be aligned towards sound decision making.
References:
- Kahneman D, Tversky Publication (1979) (Traditional modern finance) Kahneman, D., Tversky, A.: 263–292)
- Behavioural Biases in Investment Decisions: Barber D Odean year of Publication 1- December 2023.
- Risk perception and risk tolerance, Gneezy U & Potters J Year of Publication -1979
- Decision Biases in investment Choices: Benartzi .s & Thale Year of Publication-2007 Journal of Economic Perspectives
- Effect of Disposition Effect on Risk Perception and Risk Treatment and Investment Decision: Sautma Ronni, Basana, Zeplin Jiwa, Huasada, Targan Year of Publication-2018
- Information Integration and Decision Support: Richard H. Werner F.M. De Bondt, Hersh Shefrin Year of Publication -1995
- Information Integration and Decision Support: Richard H. Werner F.M. De Bondt, Hersh Shefrin Year of Publication -1995
- The Effect of Disposition Effect on Risk Perception and Investment Decision: Brad M. Barber, Richard H. Thaler, Daniel Kahneman year of Publication - (1979) prospect theory.)
- Behavioural Finance In Investment Decisions: Latifah Wulandari Binti Asburna, Ridwan Ismail Gorib, Muhammed Akbar Syifa Year of Publication -July 2023
- How Psychological Factors Influence Economic Decision Making and the Implication for Policy: Mudasir Ahmad Sofi, Irshad, Ahmad, Reshi, Dr T Sudha -Year of Publication -April 2023